Original paper: Hyperexpandable, self-healing macromolecular crystals with integrated polymer networks
In the world of engineering, crafting a material that meets the needs of your application is challenging. Often, a given material may only provide a handful of the required properties for that application. Instead, you may choose to combine two or more materials, forming a composite with all of your desired properties. In this week’s paper, Zhang and coworkers from the University of California at San Diego took a similar approach in the world of biology by combining a biomolecular crystal with a flexible polymer. The crystal provides structure to the composite and the polymer contributes to its flexibility and expandability. They showed that the composite could reversibly expand to nearly 570% of its original volume and unexpectedly found that it was self-healing.
- Figure 1. A schematic of sodium chloride showing the repeating structure characteristic of an atomic crystal. Sodium and chloride ions are purple and green, respectively. [Image courtesy of Wikipedia]
Before we dive into the meat of this paper, let’s look at the properties of crystalline materials. An example is sodium chloride, also known as table salt, shown in Figure 1. You may immediately notice that the sodium (purple) and chloride (green) ions are precisely spaced apart from each other in a repeating pattern: a single sodium is surrounded by exactly six chlorides. This predictable structure is called a lattice. Many objects can form lattices if the interactions between neighboring objects can stabilize them. In the case of table salt, the crystal lattice is formed because sodium cations and chloride anions are oppositely charged, electrostatically attracting each other.
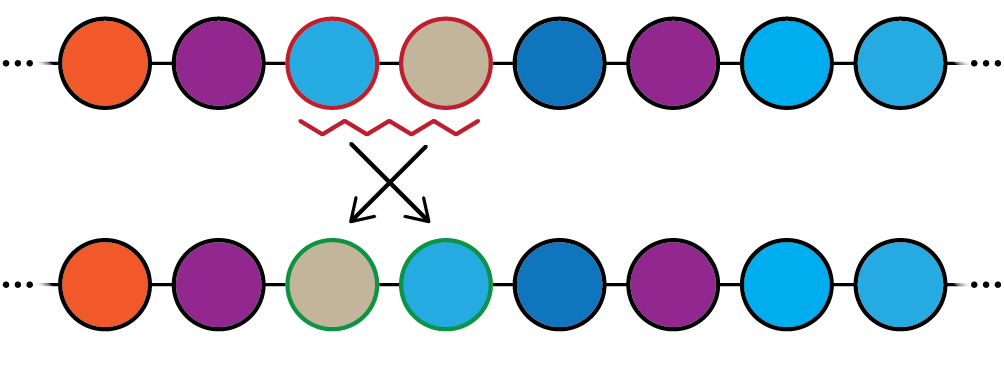
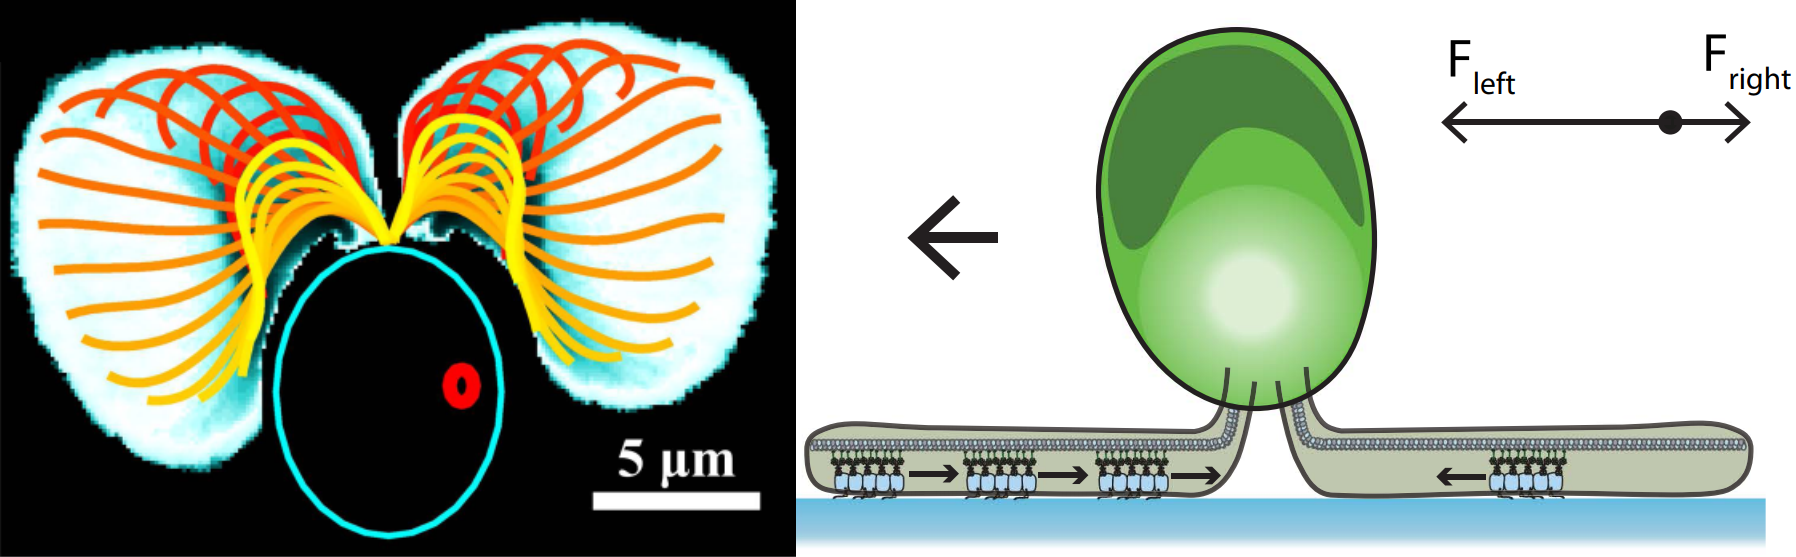
- Figure 2. (A) The ferritin crystal structure. Each sphere is a single ferritin molecule. (B) A schematic of the close contact interactions between neighboring ferritin molecules, mediated by calcium (Ca2+). (C) A cutaway of a ferritin crystal demonstrating the porosity of the crystal. Images adapted from Zhang and coworkers’ original paper.
As mentioned earlier, biomolecules are also capable of forming crystals under right conditions. Ferritin is a hollow, spherical protein that is slightly negatively charged. As shown in Figure 2A, a given ferritin molecule is in direct contact with six other ferritin molecules, forming a lattice similar to table salt. You can see in Figure 2B that this lattice is held together by neighboring ferritins strongly interacting with calcium ions at the point where they come closest together. Because of the particular packing of the ferritin molecules caused by these interactions, a ferritin crystal is quite porous. Indicated by the arrow in Figure 2C, the pores between ferritin molecules are approximately 6 nanometers wide, large enough to allow water, salt solutions, and other liquids to soak into the ferritin crystal. In fact, the close contact interactions that stabilize the crystal are easily weakened when pure water is introduced into the pores, washing out calcium ions and dissolving the crystal. Instead, Zhang and coworkers wanted the crystal to expand but remain intact in water. Thus, they needed some kind of “glue.”
[wpvideo wlaJ8h1m]
Movie 1. A video of a hybrid crystal expanding when placed in pure water, followed by contraction after being placed in sodium chloride and calcium chloride solutions (by Zhang and coworkers).
They solved this problem by introducing a positively charged polymer into the pores of the crystal lattice. These polymers are known as hydrogels, as they can absorb a large amount of water and swell to many times their dry volume without dissolving away. Note that the hydrogel can’t prevent water from breaking the close contact interactions between the negatively charged ferritin molecules. Instead, the hydrogel holds the lattice in place to prevent it from dissolving due to electrostatic attraction between the hydrogel and each ferritin molecule. The close contact interactions can then be restored when a calcium salt solution is added. As shown in Movie 1, the authors demonstrated that the hybrid crystal could be expanded to nearly 570% its starting volume in the presence of pure water and returned to its original state when exposed to salt.
[wpvideo VfJcVEAF]
Movie 2. A video showing several examples of ferritin crystal cracking and healing upon expansion (by Zhang and coworkers).
Aside from the reversible expandability of this hybrid crystal, Zhang and coworkers unexpectedly found that it can self-heal. If the crystal expands too quickly, it tends to crack, as shown in Movie 2. Despite this, the authors noticed that the cracks often healed scarlessly over time. Hydrogels cannot typically self-heal on their own, unless explicitly designed to do so. In the case of the hybrid crystal, the hydrogel and ferritin molecules work in concert to heal cracks. The hydrogel does not allow ferritin molecules on each side of the crack to drift far away. Over time, these ferritin molecules then reform the reversible close contact interactions, thereby healing the crystal. However, this process seems to be somewhat imperfect, as the crystals tend to crack in the same spots upon repeated contraction and expansion.
In short, Zhang and coworkers were able to create a self-healing material with the structure of crystalline matter and the expandability typical of polymers. Further, these hybrid materials were unexpectedly self-healing after cracking during too-rapid expansion. Many crystals formed from proteins and other biomolecules are porous like ferritin and are stabilized by similar close contact interactions. These crystals could also be infiltrated with hydrogel and similarly made expandable and resilient. As Zhang and coworkers have done, rationally combining the properties of various classes of matter will allow the engineering of novel materials for a myriad of applications and with useful, and quite unexpected, properties.