The living silly putty, episode 2: the spreading!

Douezan et al PNAS 2011

Original paper: Spreading dynamics and wetting transition of cellular aggregates


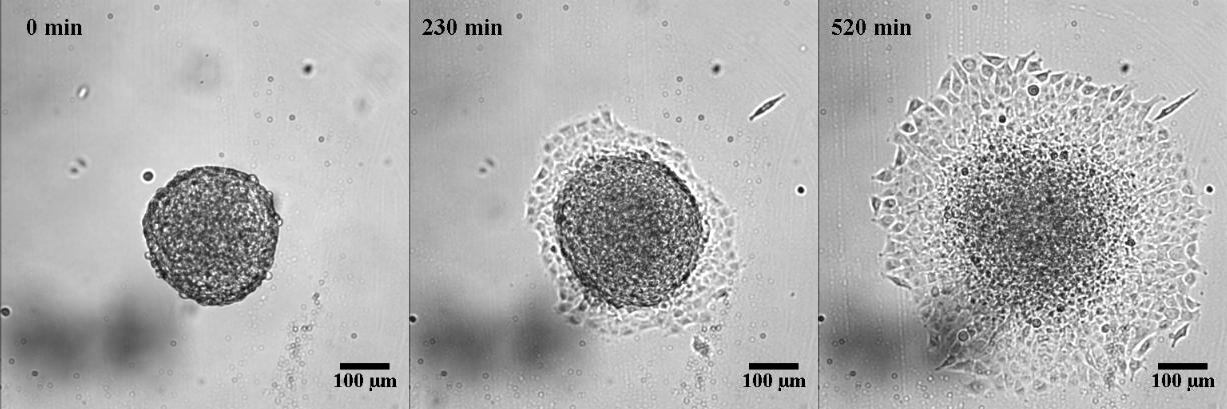
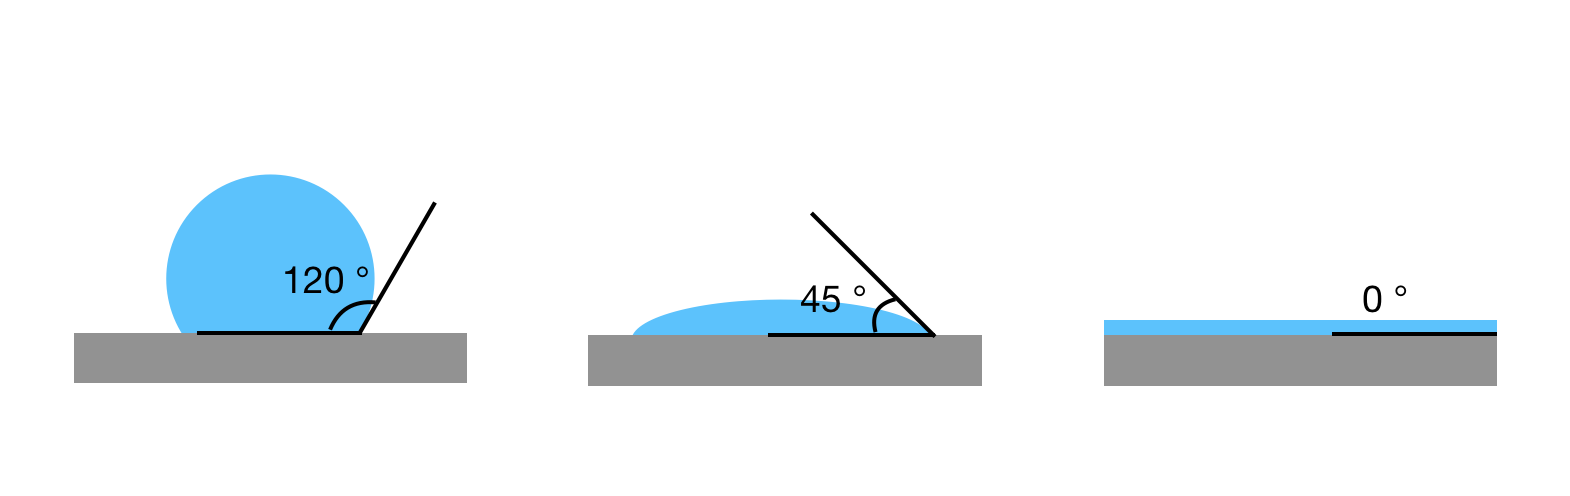
In episode one of this series, I presented a research paper by Stéphane Douezan and his colleagues in which they studied a ball of cells (called a cellular aggregate) sitting on a flat surface. After introducing the concept of cellular aggregate wetting by comparing it to the classical system of a drop of water, today I present the main part of the paper which looks at the dynamics of spreading of the cellular aggregate. I strongly suggest that the reader reads the first post before reading this one.

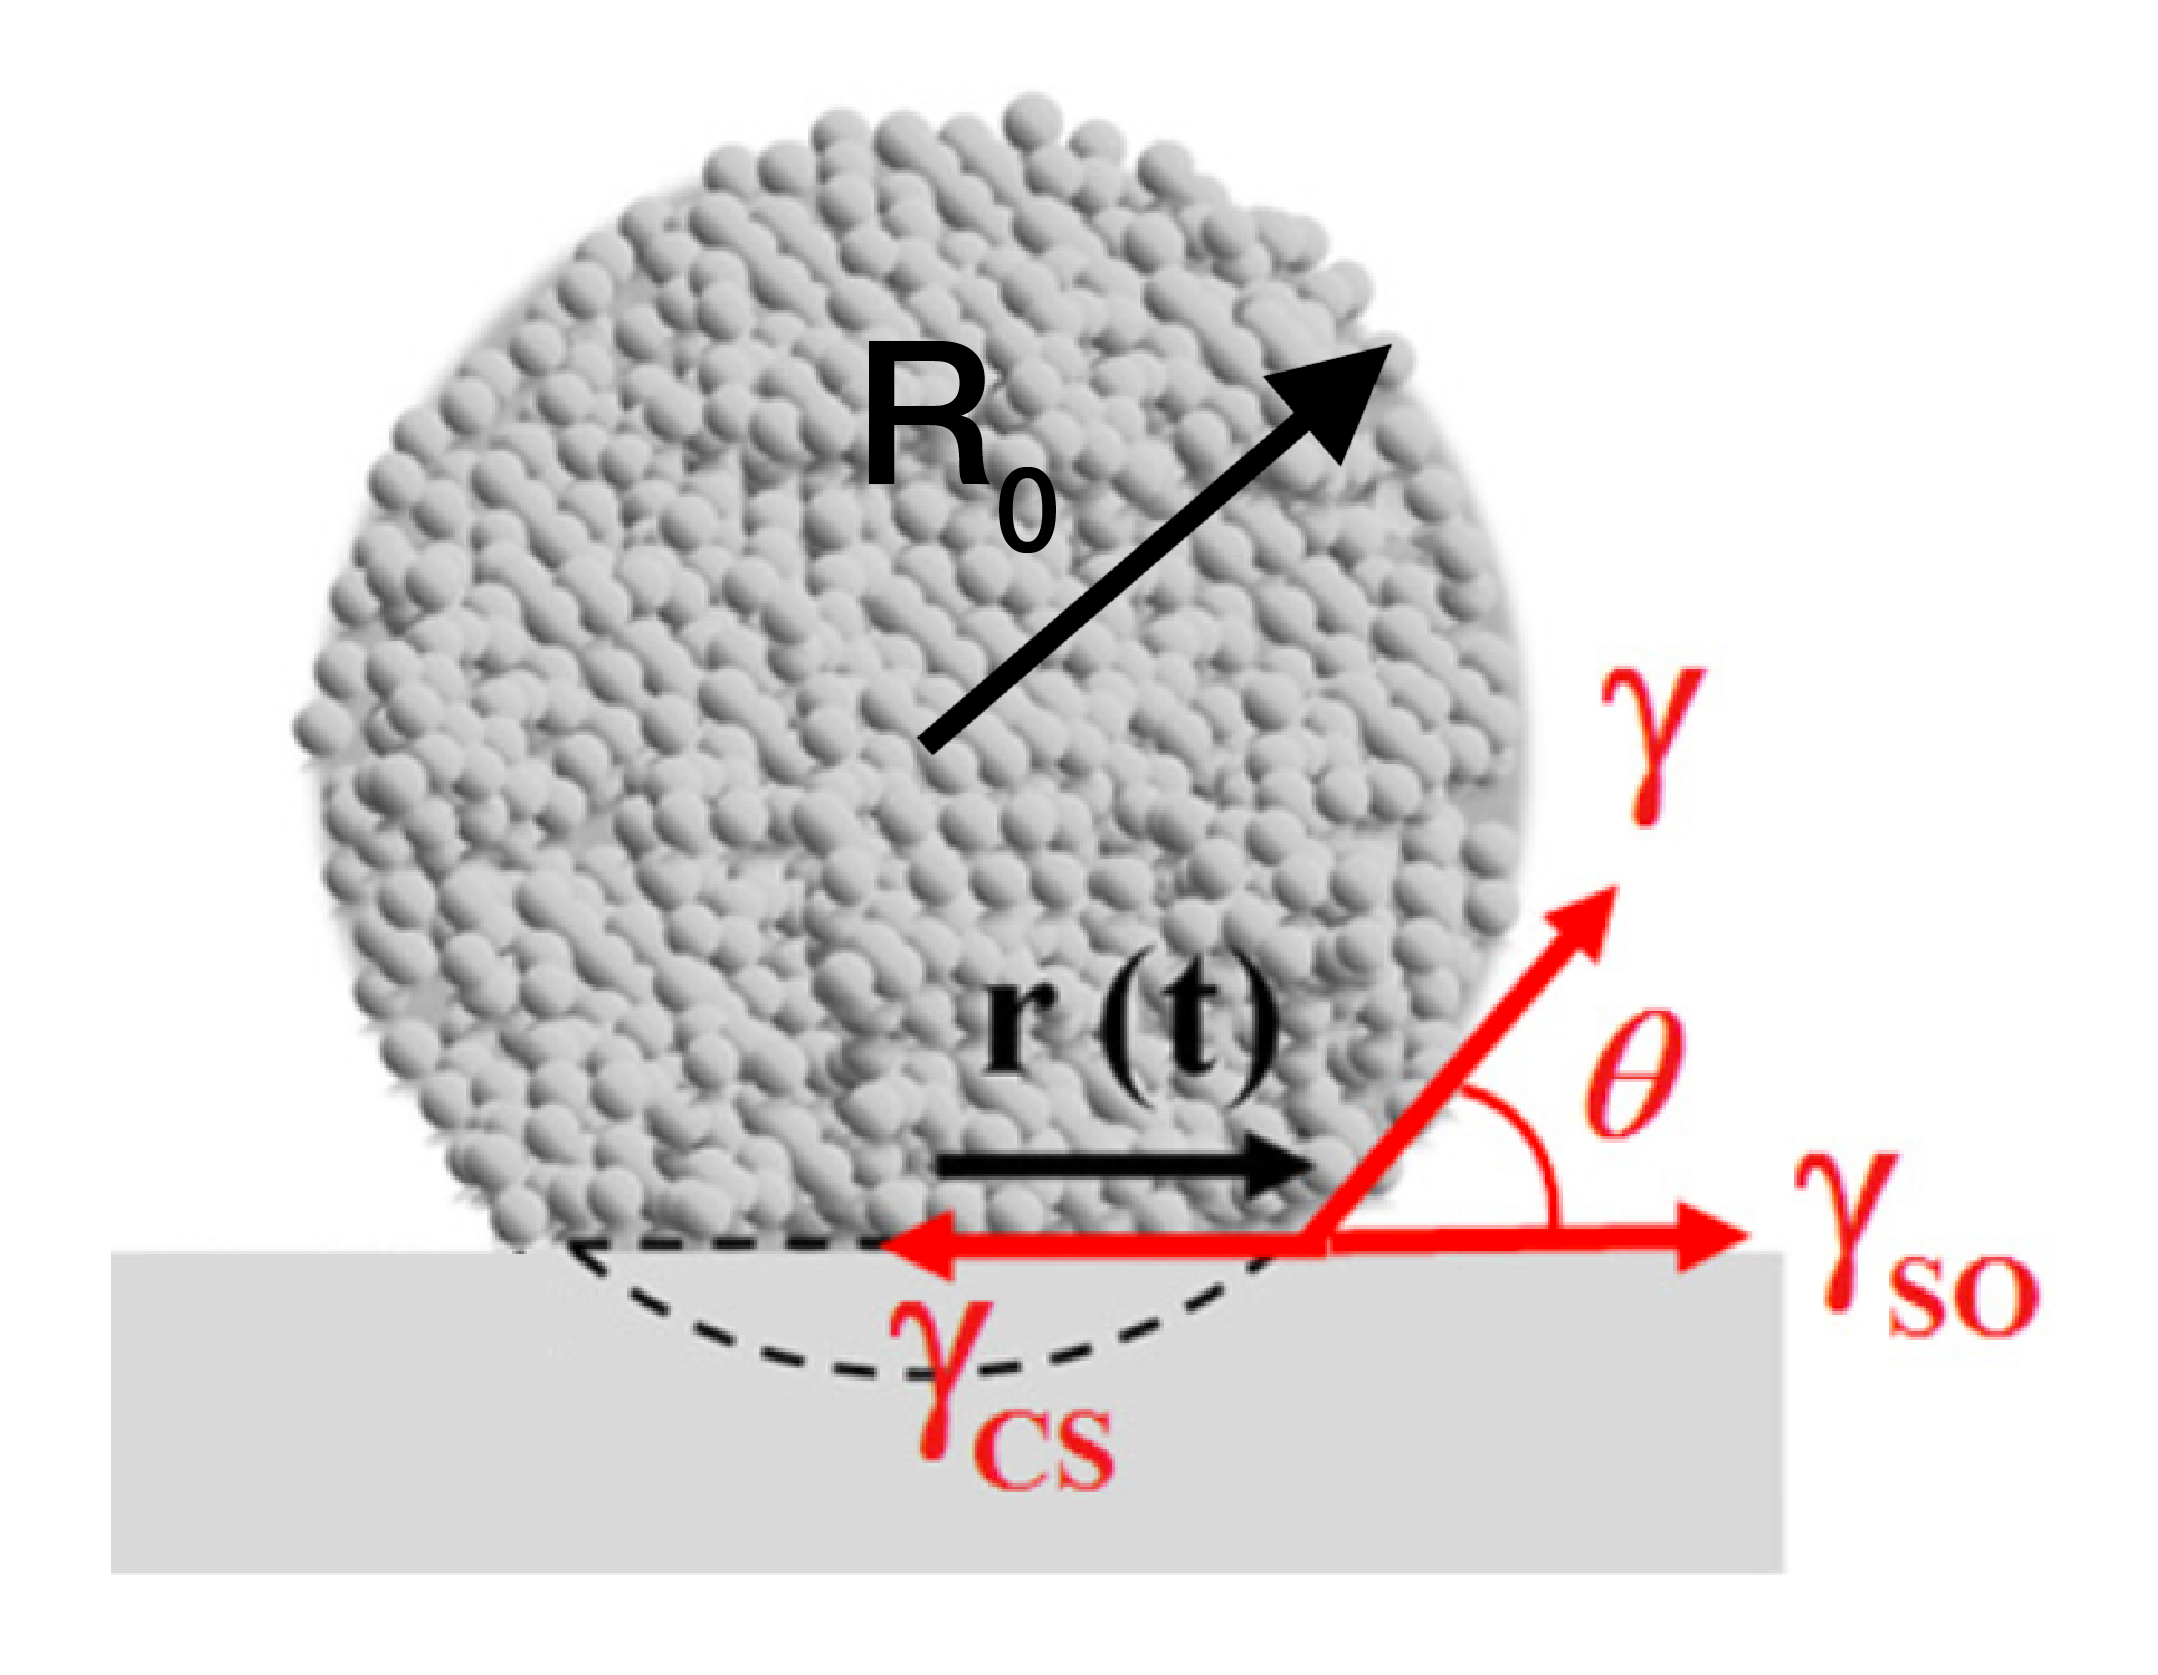
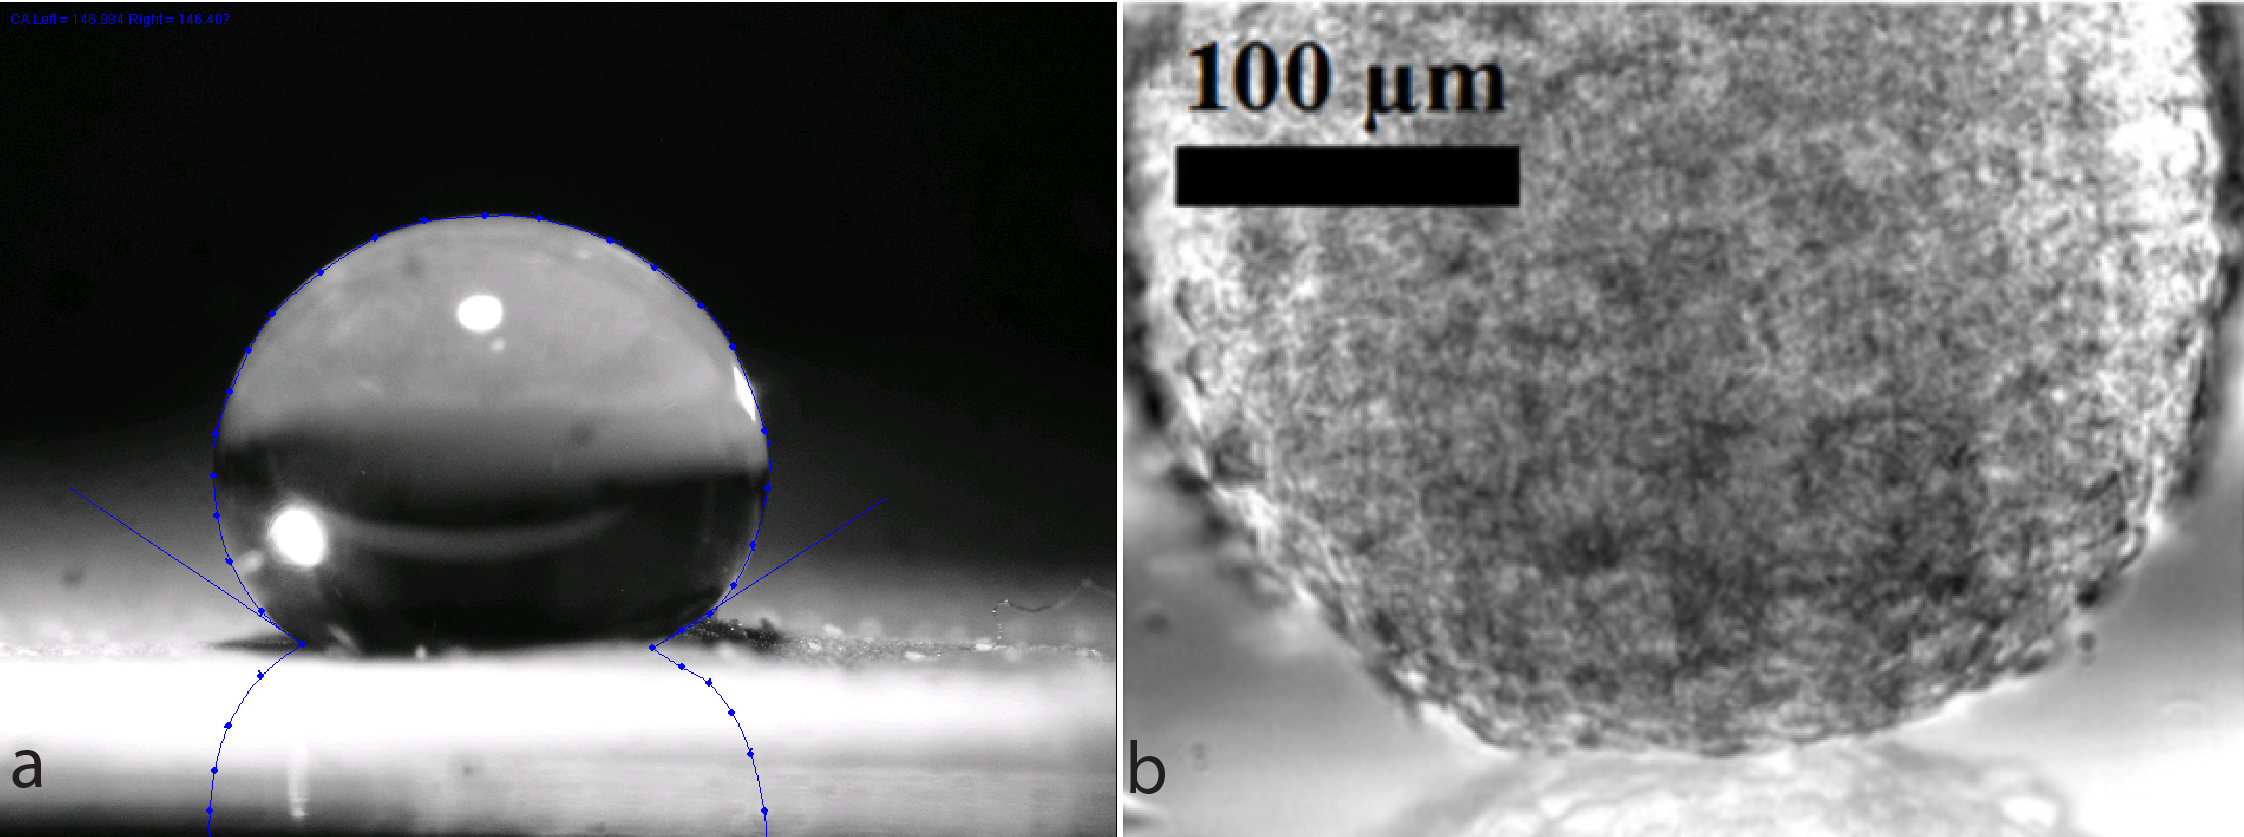
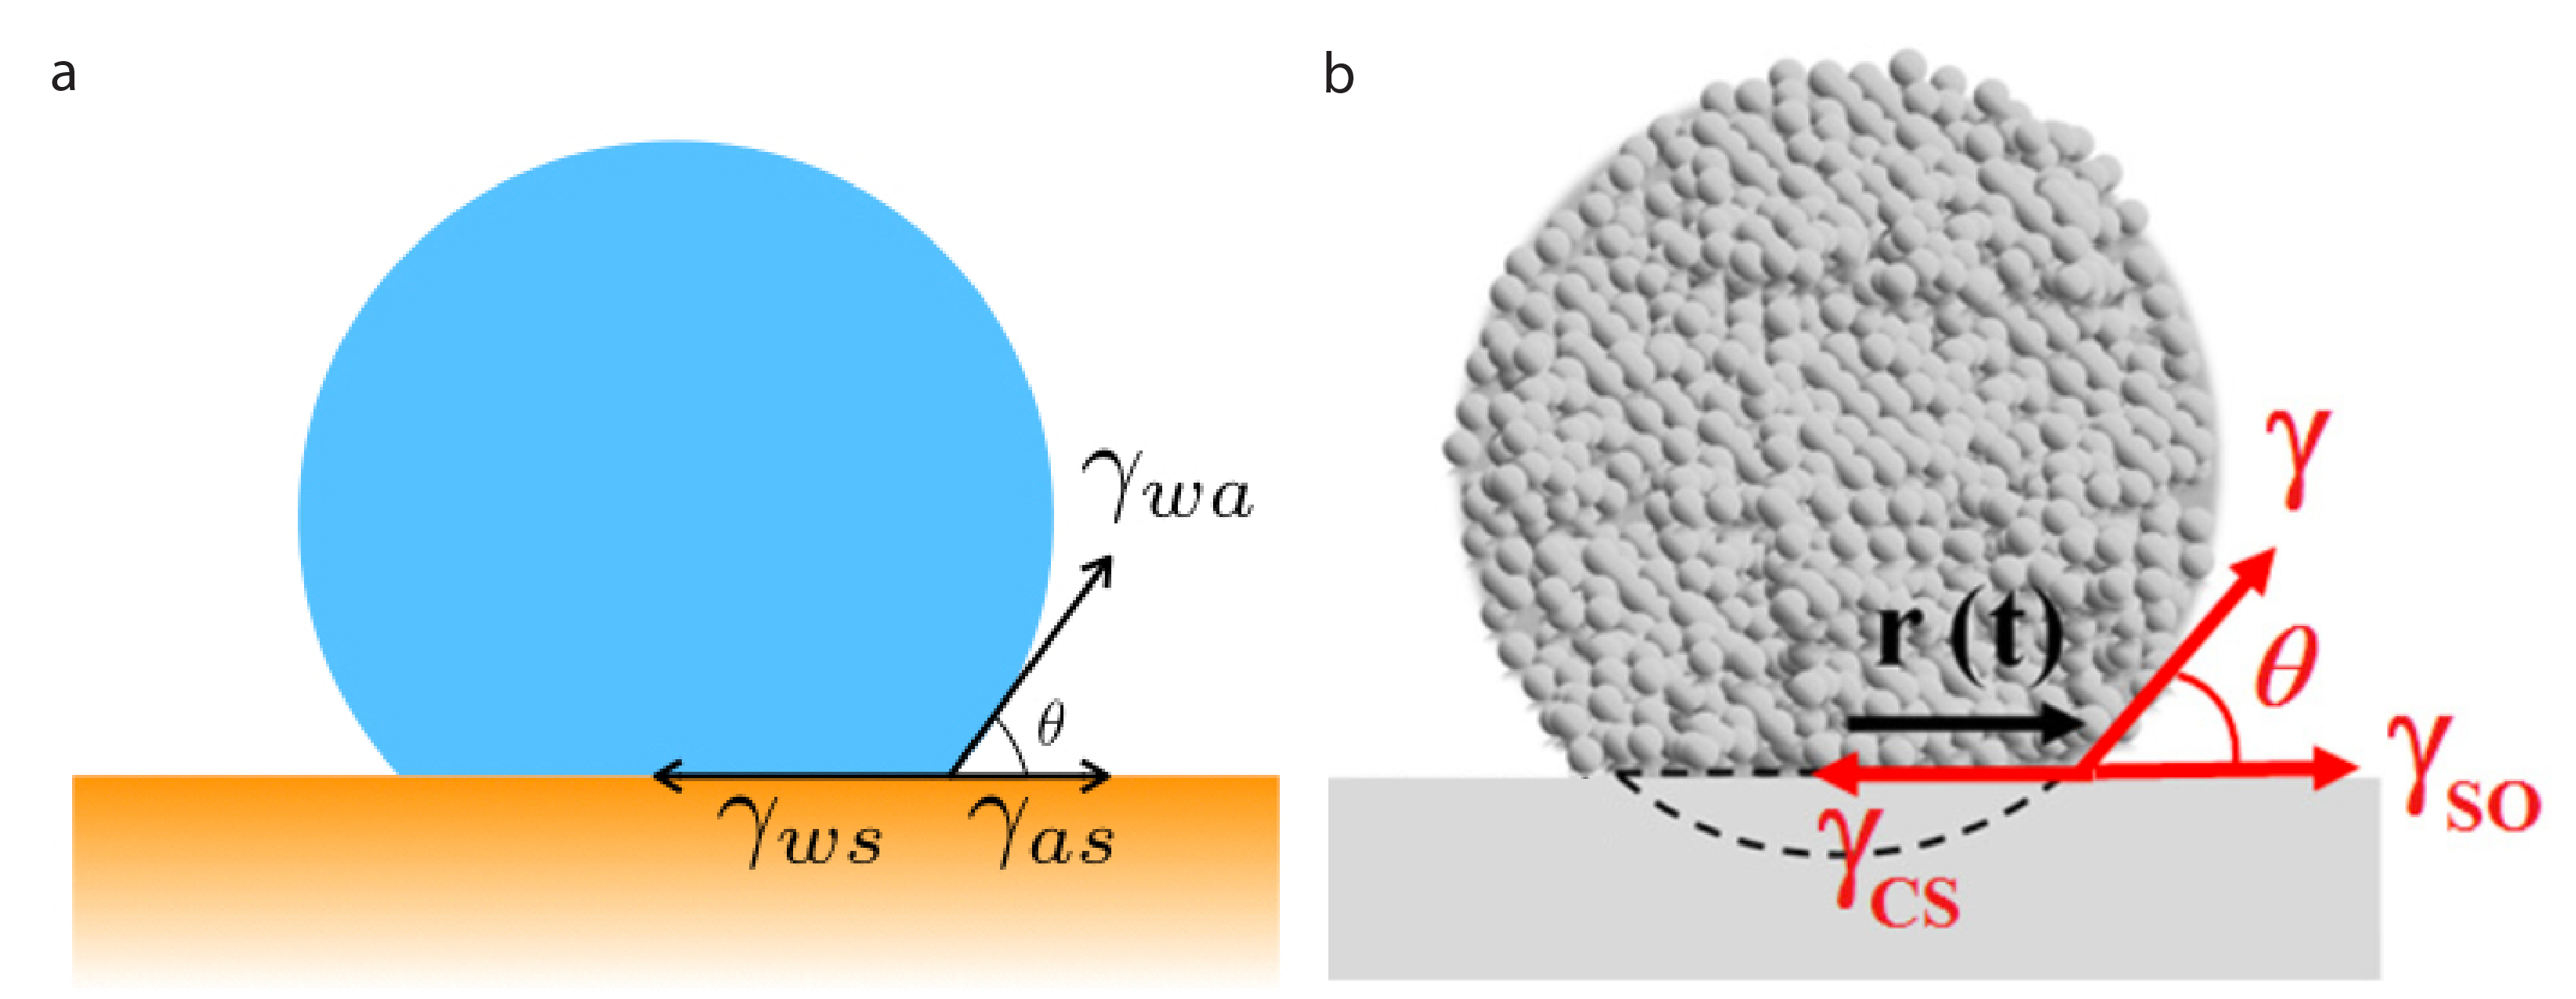
As introduced previously, the spreading of a cellular aggregate is set by the surface tensions of the three interfaces: cells-substrate (\gamma_{CS}), cells-medium (\gamma), substrate-medium (\gamma_{SO}). The spreading can be controlled by finely tuning two adhesion energies: the cell-cell adhesion (W_{CC}) and the cell-substrate adhesion (W_{CS}) [1]. The authors of this paper set W_{CC} by controlling the level of E-cadherin (a molecular glue between cells), and W_{CS} by varying the concentration of fibronectin (a molecular glue between the cells and the substrate) deposited onto the substrate.

figure 1
Figure 1. Schematic of a wetting cellular aggregate. R_0 is the initial radius of the aggregate. r(t) is the radius of the contact line. \theta is the contact angle. \gamma, \gamma_{SO} and \gamma_{CS} are the three interfacial tensions. (adapted from Douezan and colleagues.)

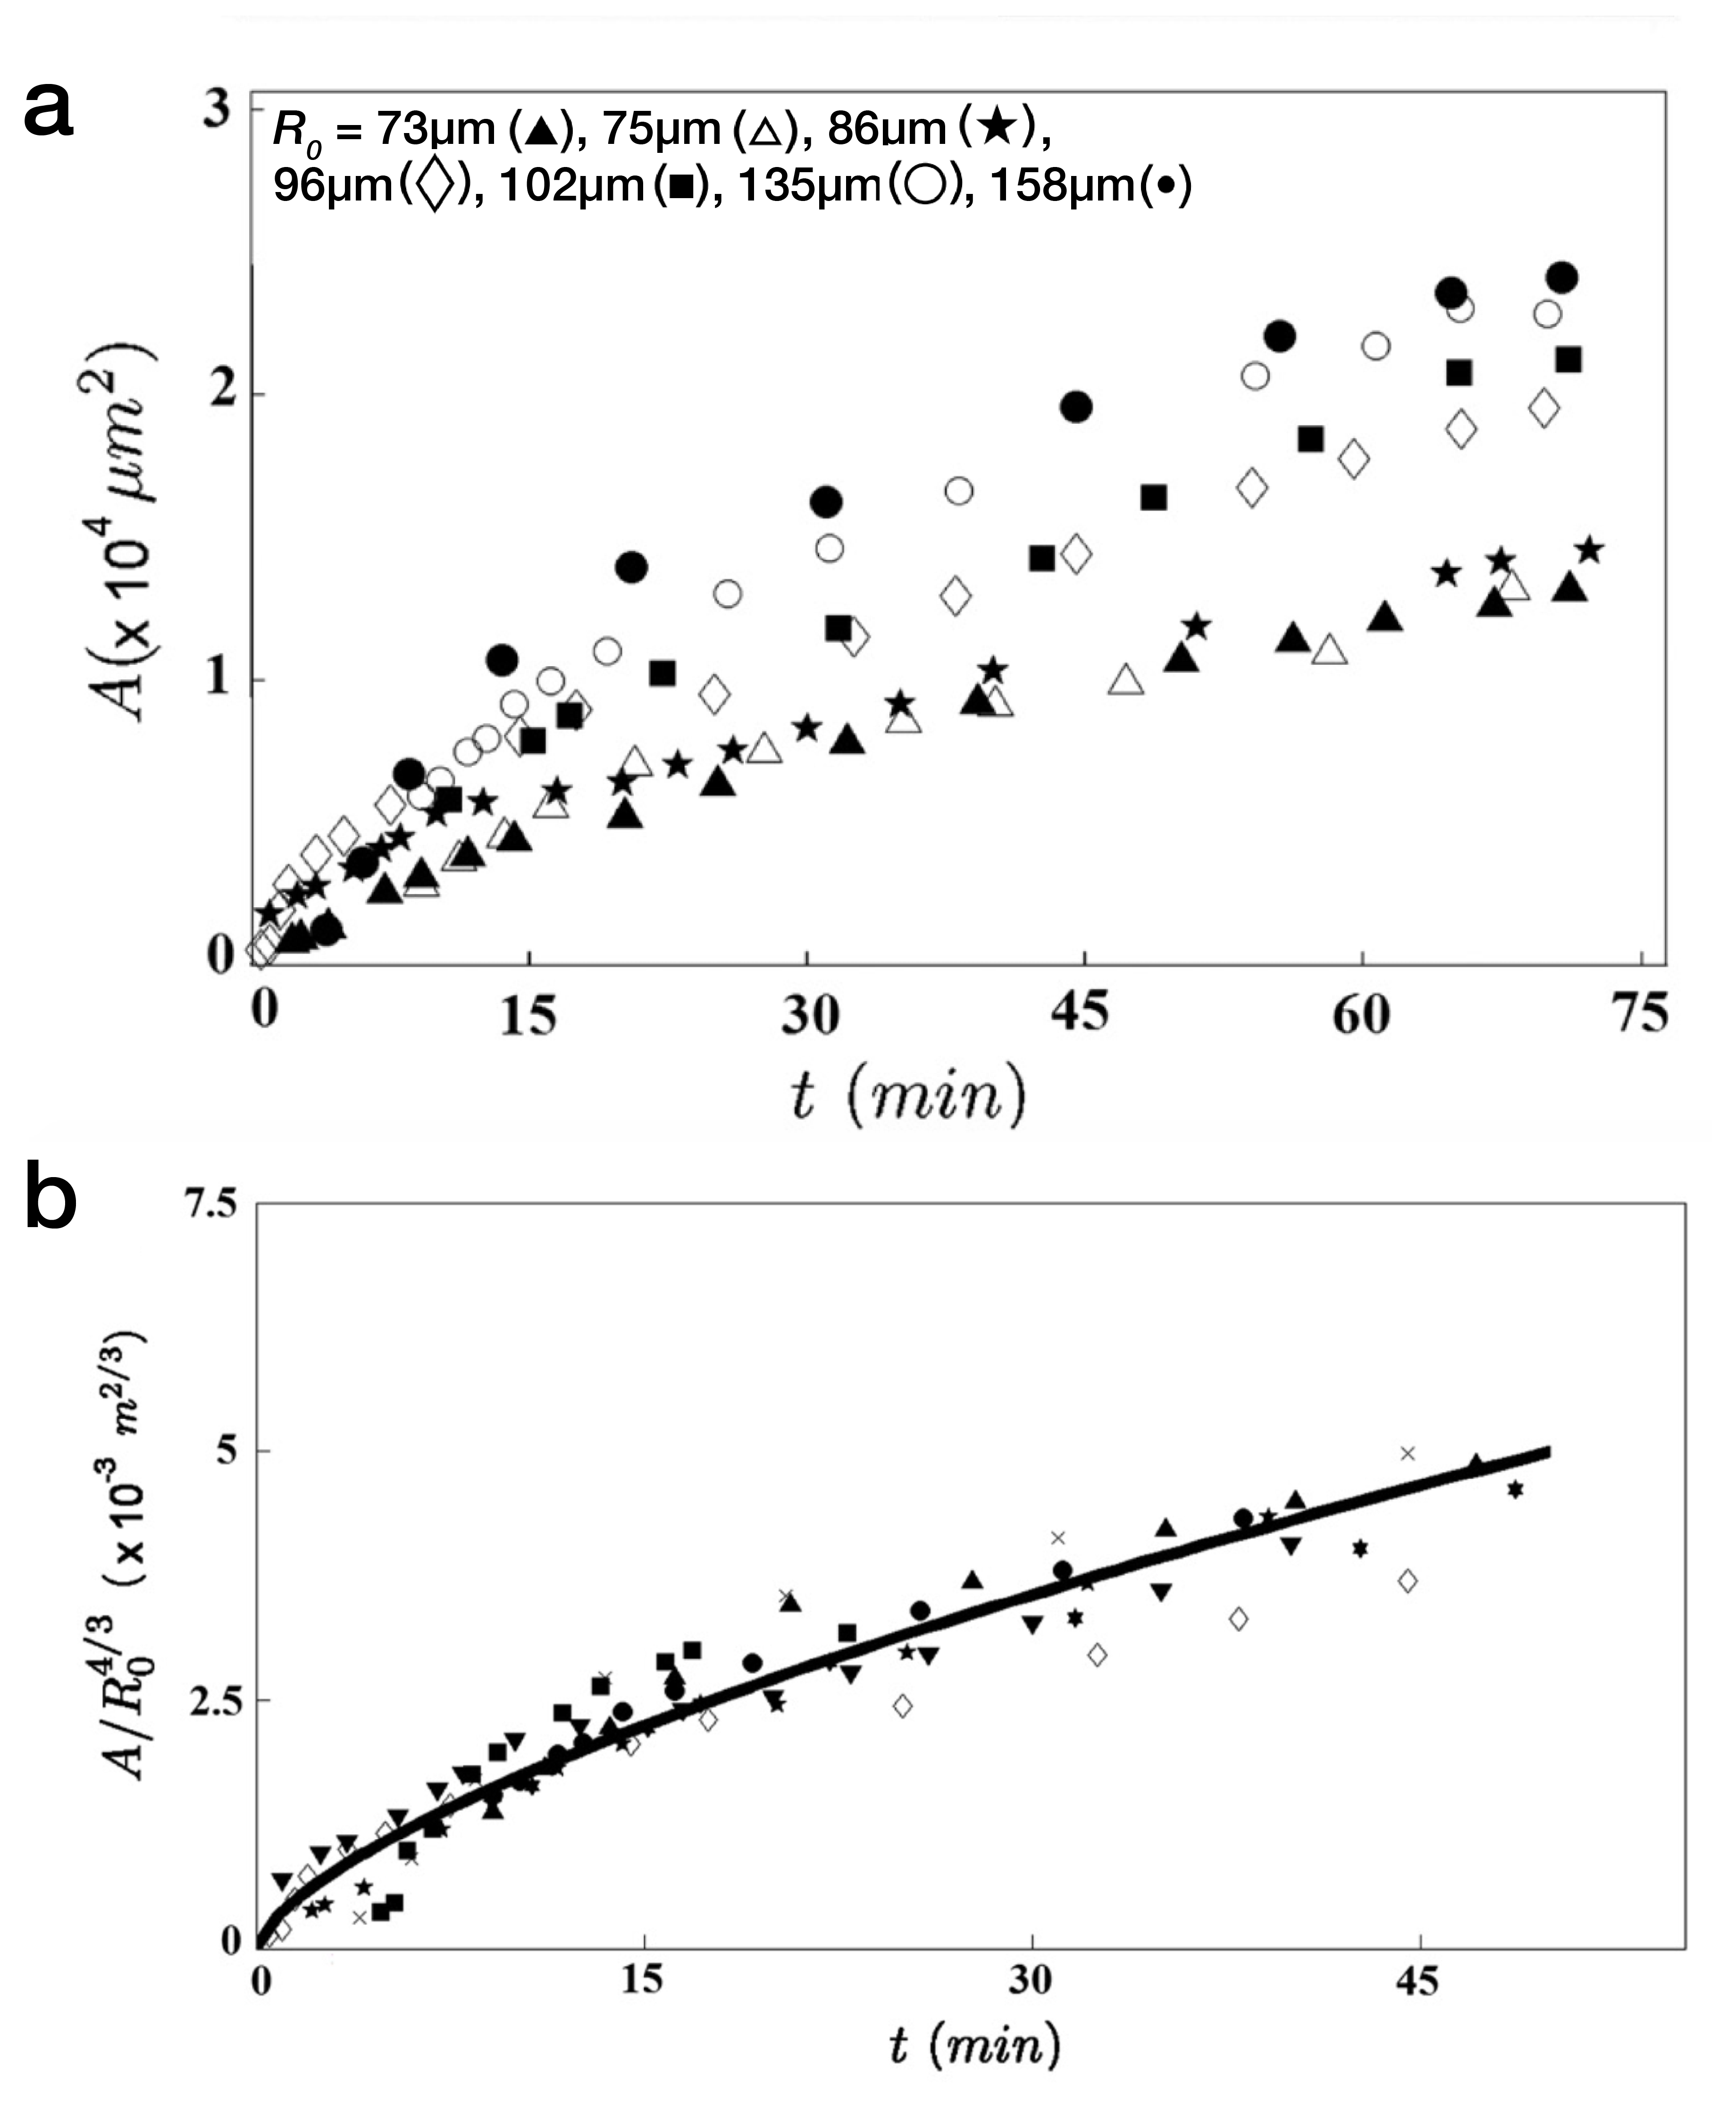
To characterize the dynamics of spreading, Stéphane Douezan and his colleagues measured the area of the cellular aggregate in contact with the surface with respect to time. The authors noticed two distinct regimes: at short times (the first hour) the cellular aggregate flattens, and at longer times, it forms a film which spreads completely. In the first regime, they observed a non-constant spreading speed. More interestingly, it depends on the cellular aggregate size: the bigger the aggregate, the faster the spreading (see Figure 2a).

To understand this non-trivial spreading dynamics, the authors investigated in detail what is driving and what is preventing the cellular aggregate from flattening at short times. The contact area expands because the adhesion between the cells and the substrate is more favorable than the cell-cell adhesion. So increasing the cell/substrate adhesion W_{CS} should increase the speed of spreading. On the other hand, the process is slowed down by the friction of the cells: there is a so-called viscous dissipation, like when you pour honey, the more viscous the honey the longer it takes to flow. So increasing the viscosity, should decrease the speed of spreading. The authors expressed the energy of these two antagonist contributions to the speed.

figure 2
Figure 2. Spreading dynamics of cellular aggregates of different sizes (adapted from Douezan and colleagues.) (a) The contact area A grows faster when the aggregate initial radius R_0 is larger. (b) The contact area scaled by R_0^{4/3} dynamics follows a power law and depends on the initial radius.

First, the energy gain is the work per unit of time of the capillary force F_c [2]:

Energy gain = 2\pi r F_c \frac{dr}{dt} [3]

At early times, the contact angle is very small, so the capillary force F_c can be simplified: F_c = W_{CS} + \gamma (cos \theta -1) \approx W_{CS} . In this way, F_c can be replaced by the constant W_{CS} in the expression of the energy gain.

Second, the authors show the dissipation is expressed by \eta (\frac{dr}{dt})^2 \frac{r^3}{R_0^2}   where \eta is the cellular aggregate viscosity. Per conservation of energy, the energy gain should be exactly compensated by the viscous dissipation. Thus, by equating these two energies and integrating r over time, we have the time variation of r^2 that follows a power law [4]:

r^2 \propto R_0^{4/3}\frac{W_{CS}}{\eta}^{2/3} t^{2/3}, with R_0 being the aggregate initial radius.

This dynamics of r^2, which is proportional to the contact area, indeed depends on the aggregate size R_0 in a consistent manner with the experimental observations: the bigger the aggregate, the quicker it spreads.

So if the law is valid, rescaling the measured area by R_0^{4/3} should remove the dependency on the size of the cellular aggregate. This is exactly what they saw: all the data points collapsed on the same curve (Figure 2b). There is something even more interesting here: fitting the spreading curve gives an estimate of the ratio W_{CS}/\eta, two variables which are difficult to measure. Of course, this is only a ratio, which does not provide absolute values for these two variables but it possible to measure relative changes by playing with some biological parameters. For instance, as mentioned above, the authors can tune the cell-cell adhesion energy using genetic tools (see the first post to understand how they measure it) and the cell-substrate adhesion by coating the substrate with different concentrations of an adhesive molecule. In this way, they quantitatively described how the viscosity decreases when the intercellular glue expression — the E-cadherin — is reduced, see Table 1. Similarly, they studied the relative change of the cell-substrate adhesion energy depending on the substrate coating.

Table 1. Relative change of the viscosity depending on the E-cadherin expression.

E-cadherin level (controls cell-cell adhesion energy) 21% 48%
Relative viscosity to the 100% expression 42% 57%

To summarize, Stéphane Douezan and his colleagues were able to explain what is driving the initial flattening of the aggregate at short times by showing how this dynamics depends on the aggregate size, and they were able to estimate the ratio of the cell-substrate adhesion energy over the viscosity.

figure 3
Figure 3: Long-time spreading. Top: cohesive cellular aggregate (E-cadherin — the molecular glue between cells — expression = 100%), liquid state. Bottom: Poorly cohesive cellular aggregate (E-cadherin expression = 21%) liquid-to-gas transition. (adapted from Douezan and colleagues.)

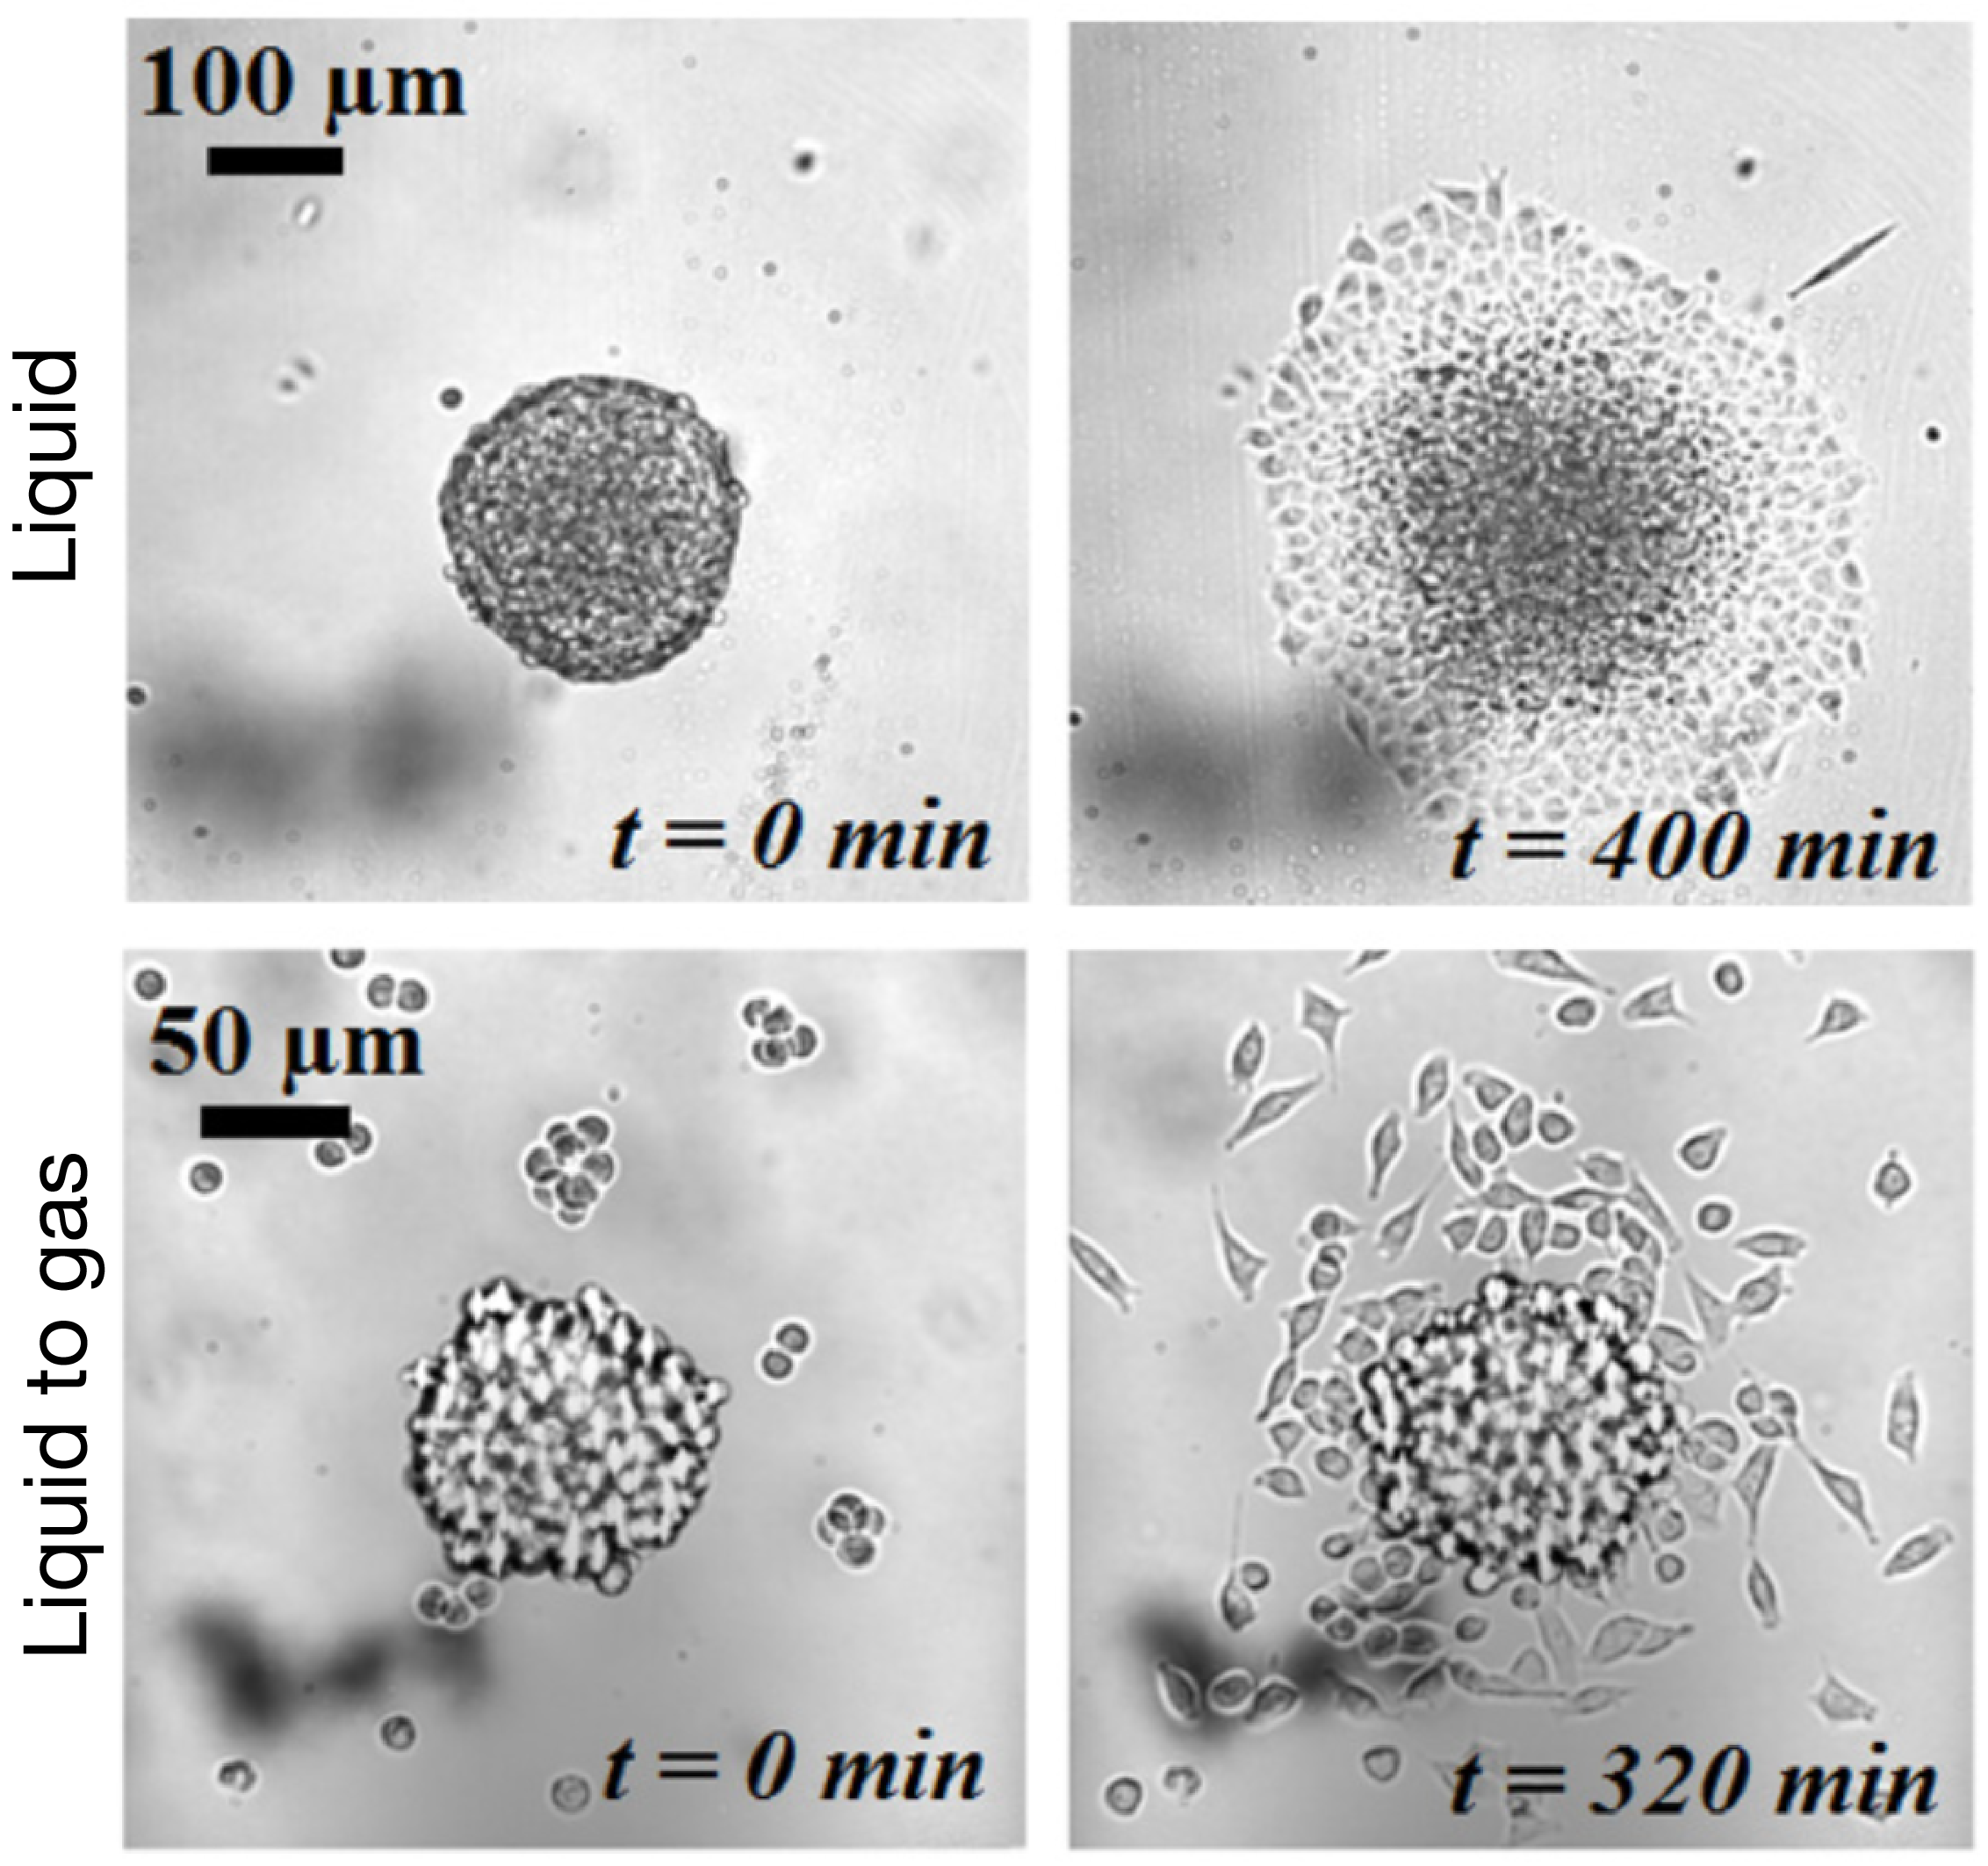
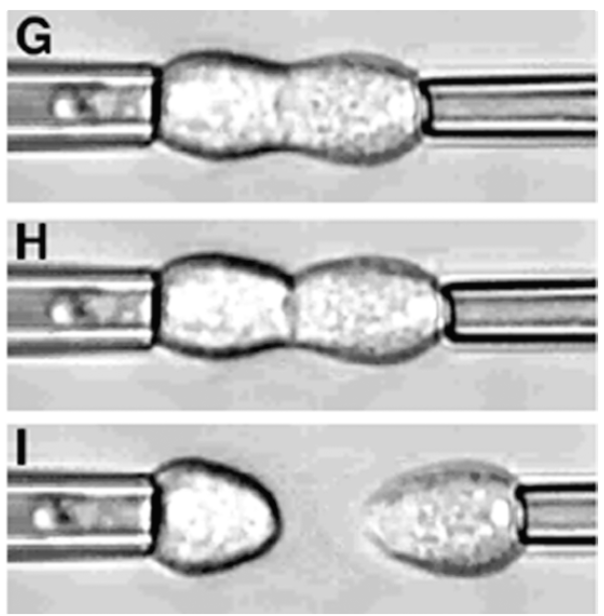
After studying this short-time regime, the authors analyzed the spreading at longer times. Depending on the cell-cell adhesion energy, they noticed two behaviors: either the aggregate flows as a cohesive two-dimensional sheet of cells (like a liquid) when the adhesion is strong, or individual cells escape from the aggregate (analogous to a liquid-to-gas transition) when the adhesion is weak. These two behaviors are shown in Figure 3 and in movie 2 and 3 of the supplementary data. This phenomenon could be used to model an invading tumor for which the biological parameters that control the transition between two kinds of spreadings can be precisely tuned.

SM02
Long-time spreading of a cohesive cellular aggregate (movie 2 of the supplementary data)

In this paper, the authors successfully captured the complexity of a biological system with a predictive law of spreading. By measuring well defined physical variables, such as the viscosity and the cell-substrate adhesion energy, they were able to quantify how cells bind to each other or to their environment. These complex biological processes, which involve many different molecular actors, are often described in a qualitative way. Even more interestingly, the authors showed how they could tune these physical variables by controlling some biological parameters, which directly shows their implications in the processes mentioned above. The approach taken in this paper is very elegant as biology often fails to be predictive because of the important complexity of the processes at stake.


[1] The adhesion energy of an interface is the work that should be spent by unit of area if one were to break this interface. The stronger the energy, the more stable the adhesion. Therefore like the surface tension, it is an energy density (unit: J/m^2). As a reminder from the previous post, the two adhesion energies can be expressed by the surface tensions: W_{CC} = 2 \gamma and W_{CS} = \gamma_{SO} + \gamma - \gamma_{CS}.

[2] The capillary force is the sum of the components of the three tensions along the tangent axis to the substrate. This force per unit of length is basically the force that pulls on the drop: F_c = \gamma_{SO} +  \gamma cos(\theta) - \gamma_{CS}.

[3] The differential expression of the energy gain is obtained through the following reasoning: during an infinitesimal duration of spreading \delta t, the radius of the contact line increases by \delta r. So the infinitesimal work of the driving force F_c is: \delta W = perimeter * F_c * \delta r = 2\pi r F_c \delta r.

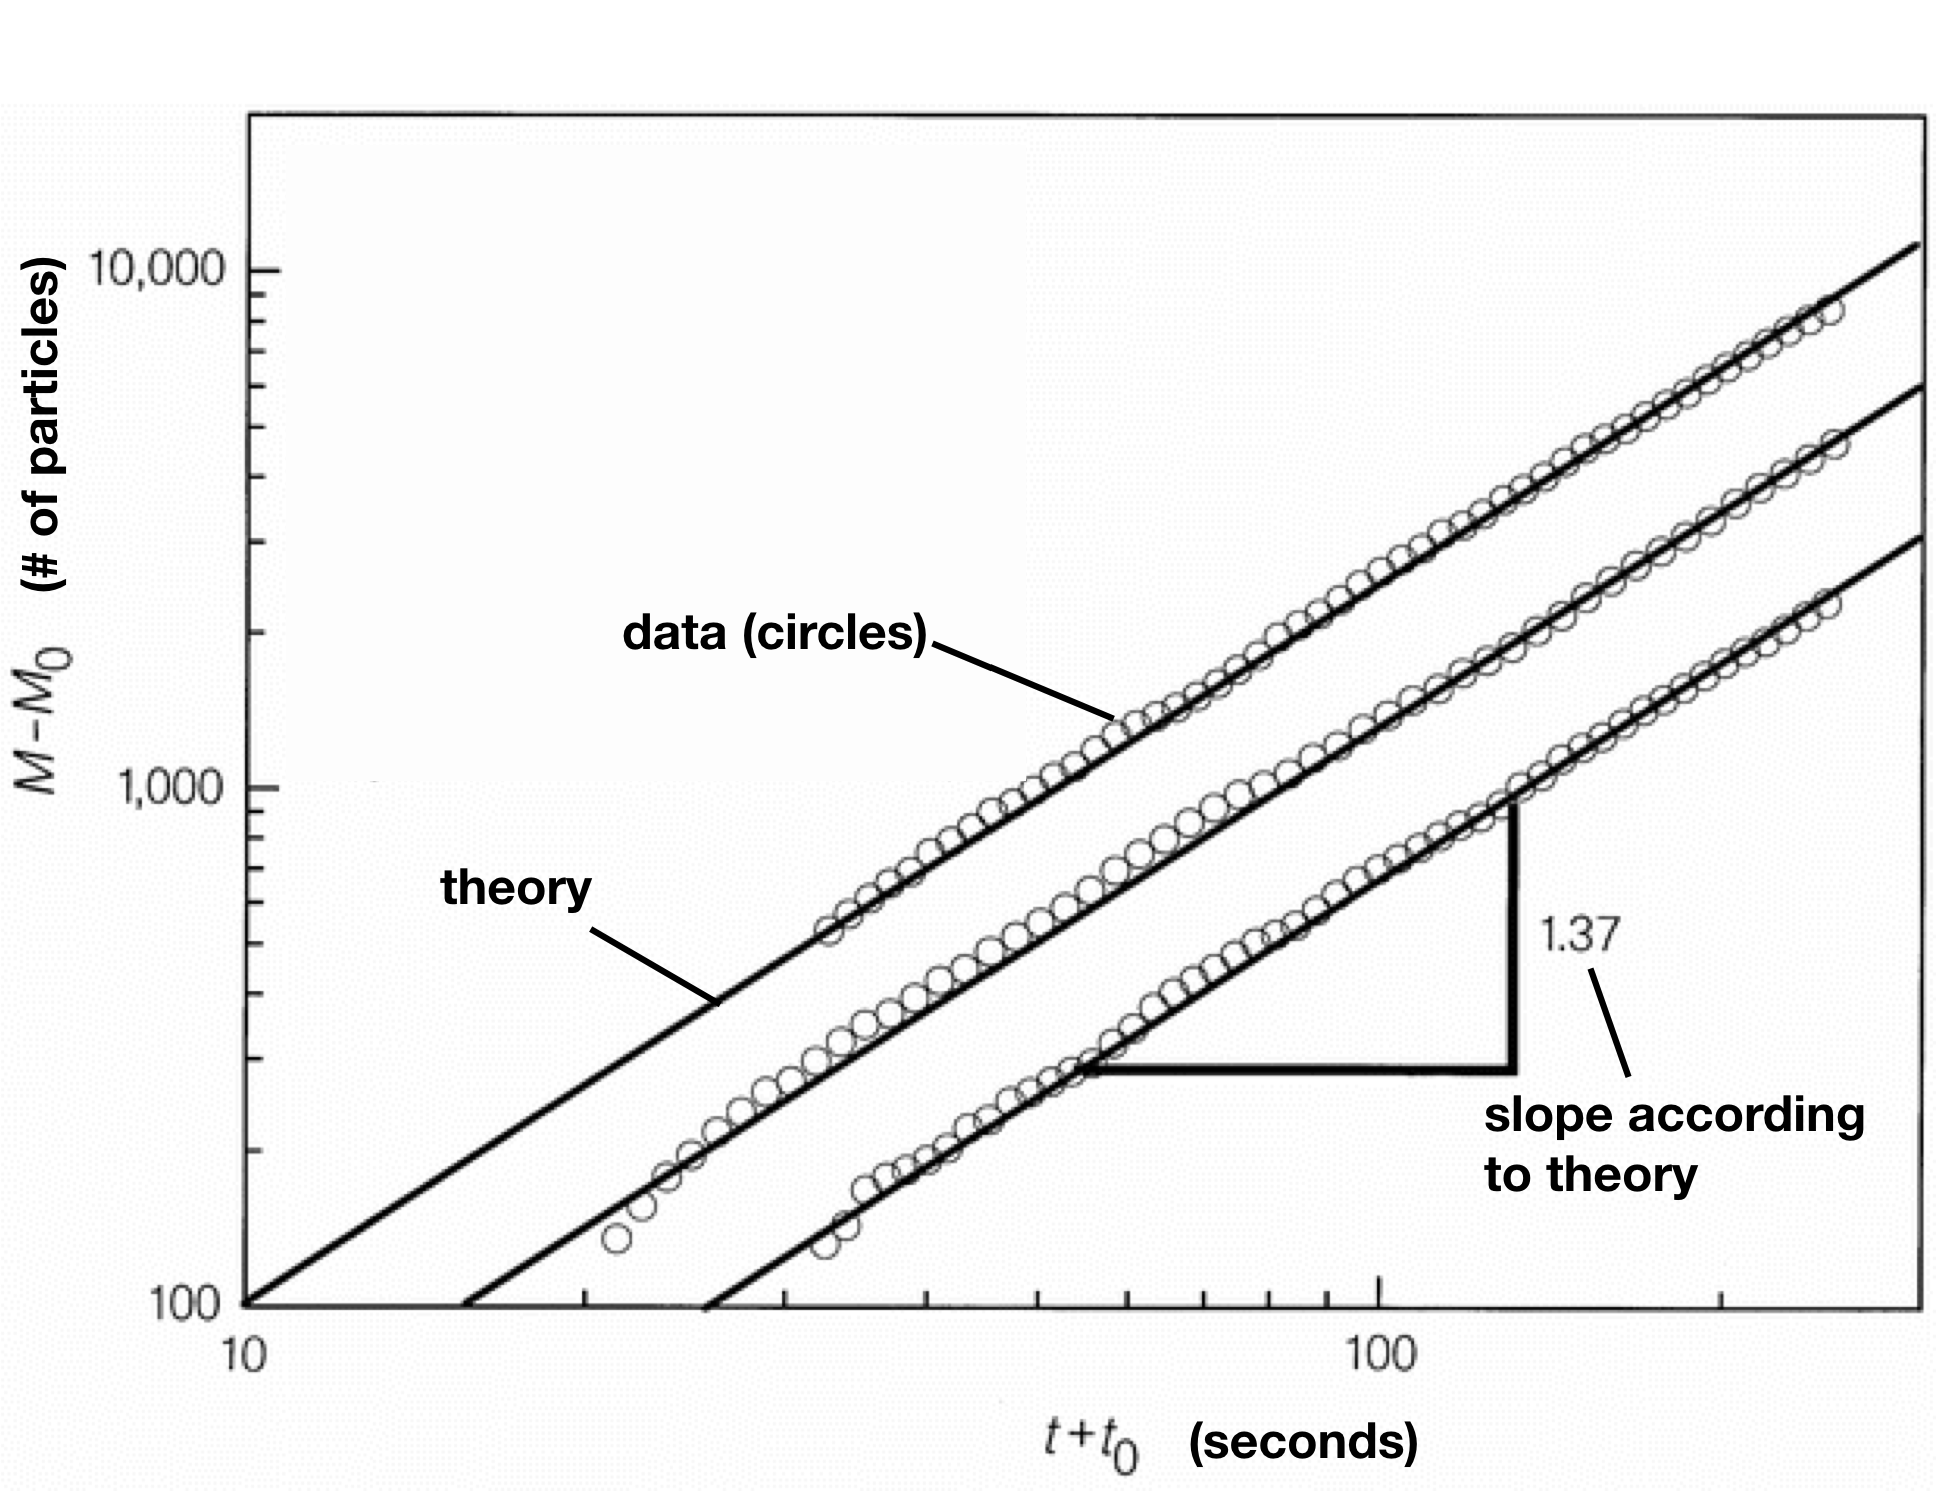
[4] A power law is simply a mapping of a variable at some power. They are usually presented on log-log plots, as they appear as a straight line, for which the slope is the power of the function.


Disclosure: The second author of this paper is my Ph.D. supervisor. However, she did this work while she was a postdoc. Consequently, I have never been involved in this work.

The living silly putty

Original paper: Spreading dynamics and wetting transition of cellular aggregates

Disclosure: The second author of this paper is my Ph.D. supervisor. However, she did this work while she was a postdoc. Consequently, I have never been involved in this work.


Have you ever noticed how drops of water have different shapes on a clean piece of glass and in a frying pan? The frying pan surface is coated with a hydrophobic (“water-repellant”) molecule so it does not stick to food, which typically contains a lot of water. As a result, a drop of water will take a roughly spherical shape to reduce as much as possible its area of contact with the frying pan. If a surface has an even more hydrophobic coating than a frying pan, the drop can even reach a perfectly spherical shape (this is called ultrahydrophobicity, or the lotus effect). At the opposite extreme, glass is said to be hydrophilic (“water-loving”) — when placed on a clean piece of glass, a drop of water tries to increase its surface of contact much more than a droplet on a hydrophobic frying pan. Depending on the hydrophilicity of the underlying surface — which is known as the substrate — the drop has a well-defined area of contact. The interaction between fluid interfaces and the solid surfaces is a very well studied field of soft matter called wetting. Researchers in this field investigate how the three different interfacial energies — interfaces between water and substrate, between water and air, and between substrate and air — dictate what shape a droplet takes, and how it spreads across the surface.

fig-01
Figure 1. (a) Water drop on an ultrahydrophobic surface (public domain image). (b) Cellular aggregate after deposition  (adapted from Douezan et al.)

Today’s post is the first one of a series of two (click here for the second one), which deals with the work of scientists who replaced the drop of water by balls of living cells called cellular aggregates. They deposited these aggregates onto different surfaces to carry out an experiment analogous to the spreading of water droplets. In the case of a drop of water, only the physical and chemical interactions between molecules determine the shape of the drop. When a drop sits on a substrate there is an interface between the water and the substrate. If the chemical interactions between the substrate and the water are not favorable (hydrophobic), the price to pay will be a large interfacial energy. As every system in physics, it tries to reduce its overall energy by reducing the area of contact. The drop shrinks, like the ones you can see in your frying pan. But as it shrinks, the interface area between the substrate and air increases by freeing the surface. And, as the volume of water is fixed (we consider a no-evaporation situation), the surface of the drop in contact with air changes too. Therefore, the drop shrinks or spreads up to a point for which the sum of the three interfacial energies is minimized.

fig-02
Figure 2. (a) Schematic of a wetting drop. (b) Schematic of a wetting cellular aggregate (from Douezan et al.)

The shape of the drop can be described by the contact angle ?, which can be used to predict the interfacial tensions, which quantify how the interfacial energies change when the areas of contact are changed. A tension is a force divided by a length. So, we can write the equilibrium of tensions on the point where the three interfaces meet (1):

\gamma_{ws} = \gamma_{as} + \gamma_{wa} cos\theta

To predict if the drop will spread on the surface the wetting coefficient S can be defined as:

S = \gamma_{as} - ( \gamma_{wa} + \gamma_{ws} )

S = - \gamma_{wa} (cos\theta -1)  (by using the equilibrium of tensions) (2)

This expression shows that there is a partial wetting (\theta between 0 and \pi) if S<0. If S>0, the drop spreads completely: that is, the droplet covers the substrate with an infinitely thin fluid film.

Now, what happens if we consider a ball of cells instead of a drop of water? Since the pioneering work of Malcolm Steinberg, we know that cellular aggregates can behave as liquids over long times. If you were to poke a piece of biological tissue, it would resist at short times (less than a dozen of seconds to a couple of minutes) but on the long run, it would start to flow. As every liquid, a surface tension builds at its interface. For instance, a rough ball of cells in suspension will round up over time to minimize its ratio area/volume. As presented in a previous post, the surface tension is a physical value that can also be defined for biological tissues even though its nature is very different from the one of purely physical systems.

To further investigate the role of surface tension in living tissues, Stéphane Douezan and his colleagues decided to study how the biological properties of these aggregates of cells can influence their liquid behavior. The first property they considered was the “stickiness” of the cells, also known as cell-cell adhesion. Cells produce a large number of molecules at their surface which allows them to sense and interact with their environment. E-cadherin is an important molecule that acts like a kind of glue between cells, allowing them to stick to their neighbors. Using genetic tools, the researchers grew cells with different levels of E-cadherin, making them more or less sticky with respect to the others. By using micropipettes to pull on two sticking cells until they broke apart, the researchers then measured the energy of cell-cell adhesion. Integrating the force exerted during the separation and dividing by the contact area leads to the cell-cell adhesion energy W_{CC} .

fig-03
Figure 3. W_cc measurement (adapted from Chu Y.-S et al.)

The authors played with a second property too. In living tissues, cells interact with the extracellular matrix — a scaffold of molecules that gives the tissue its structure. One of the important molecules of the extracellular matrix is called fibronectin. By coating the glass substrate with different concentrations of fibronectin, the researchers could finely tune the adhesion of the cells to the substrate. To measure this adhesion: the researchers define the cell-substrate adhesion energy, W_{CS} .

In order to know if an aggregate will spread, the wetting coefficient S = \gamma_{SO} - (\gamma + \gamma_{CS}) must be evaluated. However, not all these tensions can be measured directlyso they must be expressed in term of the energies we can measure W_{CS} and W_{CC}. A classical approach to connect the adhesion energy to the tensions is to write the balance of tensions if we were to break an interface. For instance, to separate a cell-cell interface, two new interfaces (between the cells and the surrounding fluid) must be created so, by energy conservation: W_{CC} = 2 \gamma. Similarly, breaking a cell-substrate interface requires creating an interface between the cell and the surrounding fluid, an interface between the substrate and the fluid, and removing a cell-substrate interface, so: W_{CS} = \gamma_{SO} + \gamma - \gamma_{CS}.

Therefore, the wetting coefficient becomes S = W_{CS} - W_{CC}. If S>0, the energy of adhesion with the substrate is larger than the cell-cell adhesion energy, and the aggregate spreads completely. In this case, the dynamics of spreading can be monitored, as you can see in this video of wetting (video S1).

In the next post, I will present the dynamics of spreading, where the cellular aggregate literally behaves as a chunk of silly putty!  


(1) In reality, the three interfaces meet at the line that circles the drop, but since the system has a circular symmetry, it makes more sense to write the tension balance on a point instead of writing the force balance all along the circle.

(2) Usually, \theta is defined as the complementary angle (\theta ' = \pi /2 - \theta), so S=( cos\theta ' - 1 ) \gamma_{wa} . But here I decided to use the same definition as the authors for the sake of consistency.


Dripping, Buckling and Collapsing of a Droplet

The scale bar is 20 micron.

Original paper: Mechanical stability of particle-stabilized droplets under micropipette aspiration


Most of us have had the childhood experience of blowing bubbles. But have you ever wondered how bubbles form and what keeps them stable? The key to making bubbles is surface tension, the tension on the surface of a liquid that comes from the attractive forces between the liquid molecules.  Water has a very high surface tension (that’s why bugs can walk on water) making it difficult to stretch to form a thin water layer that we see when bubbles form. By adding soap to water, we can lower the surface tension of the water, allowing us to stretch this water-air interface to form a thin water sheet. As you blow more and more air into a bubble, the bubble will grow larger and larger as the thin layer stretches. Eventually, you’ll reach the limit of the added stretchiness, and the bubble will burst, engraving in your memory its fragile nature.


Fig1-1
A typical air bubble made out of a water-soap mixture (Figure courtesy of Gilad).


In soft matter, sometimes scientists utilize materials such as solid macroscopic particles instead of soap molecules to reduce the surface tension of an interface. Using particles to stabilize an interface allows them to tailor the mechanical and chemical properties of the interfaces to fabricate capsulesFor instance, if a capsule needs to travel in blood-stream for therapeutic purposes, it must be tough enough to withstand blood pressure without rupturing. But if we make such a capsule how can we measure its mechanical response?

In this post, we’ll look into the work by Niveditha Samudrala and her colleagues on measuring the mechanical properties of a particle-stabilized interface. They utilize a direct approach of applying force on such a stabilized interface to study its mechanical response that has eluded earlier techniques. Knowing the stiffness of these particle-coated interfaces, say in the form of capsules, would enable us to use them for different controlled-release applications such as treating a narrowing artery [1] as well as tune them to have different flow properties. 

The authors use tiny (smaller than a micrometer!) dumbbell-shaped particles with different surface properties to stabilize an oil-in-water emulsion (see note [2]). Here instead of a thin layer of water sandwiched by the soap molecules, the water-oil interface has been stabilized with micron-sized particles. This stabilization technique will render higher mechanical properties to the interface. Droplets stabilized in this way, known as colloidosomes, have been shown to be capable of encapsulating a wide variety of molecules.

The researchers characterized the particle-stabilized droplets using the micropipette aspiration technique. To understand this technique, imagine picking an air bubble with a straw. What you need to do is to approach the air bubble and then apply a gentle suction (or aspiration) pressure. When the suction pressure becomes larger than the pressure outside of the droplet, then the droplet gets aspirated into the straw forming the aspiration tongue (Figure 1A). Similarly, in the micropipette aspiration technique, a glass pipette (the straw) with an inner diameter of R_p is usually used to aspirate squishy stuff, such as cells, vesicles, and here droplets. 

To obtain the tension response, therefore the toughness of an aspirated interface, we need to consider the pressures applied to the interface. Let’s consider an aspirated droplet as shown in Fig 1A at mechanical equilibrium (which means the sum of all the forces is zero). We know that each interface has a surface tension acting on it (See Fig 2a). In our bubble example, I mentioned that the soap molecules tend to gather at such interface to decrease the tension (See Fig 2b). But when there are other forces acting on the interface in addition to the presence of the molecules, such as the suction pressure in our case, the tension of the interface now comes from both the surface tension and the suction force. We call this total force the interfacial tension (See Fig 2c). The Young-Laplace equation can be used to relate this interfacial tension to the pressure applied to the interface (Fig 1-B3). 

Fig1
Fig1. Schematic representation of the aspiration technique (A) and the Young-Laplace equations obtained at both interfaces of the outer edge of droplet and tongue inside the pipette (B). P_{atm} is the atmospheric pressure set to zero, P_{droplet} is the pressure inside the droplet. P_{pip} is the suction pressure. R_{v} is the radius of droplet outside the pipette and the R_{p} is the pipette radius.

When the molecules, or particles in our case, are forced to pack tightly together they oppose the compression force. This opposition is felt at the interface by a pressure called surface pressure (see Fig 2c). Under the interface tension and the surface pressure, the new net interfacial tension is defined as:

\tau=\gamma_{0} - \Pi.

where \Pi is the surface pressure, \gamma_{0} is the interface tension which is constant for a given interface. 

In this study, Samudrala and her colleagues show that there are two critical pressures after which instabilities form at the interface resulting in droplet dripping into the pipette and buckling respectively (Fig 2d). They conclude that the dripping happens due to the transition of the interface from a particle-stabilized interface to a bare oil-water interface resulting in a sudden suction of tiny oil droplets (basically the droplet drips at this point, see Fig 3B, blue and 3C).

The second instability is the buckling which the researchers propose happens when \tau tends to zero. Now let’s see how buckling happens.

interface
Fig 2. The schematic of a particle-stabilized water-oil interface under different load is shown. (a) shows the bare water-oil interface. This interface has a constant, material related surface tension, the \gamma_{0}. (b) depicts a particle-coated interface. The aggregation of the particles at the interface, decrease the interface tension to a new value of \gamma. (c) the particle-coated interface is compressed from both ends. This case happens in our case when the particle-coated droplet is stretched (see the text). (d) the compressed interface reaches a critical pressure upon which the net tension of the interface is zero and the buckling happens as the interface cannot no longer endure the imposed force.

The dripping at the first critical pressure decreases the volume of the particle-coated droplet, but note that the surface area is constant because neither particles leave the surface nor the free ones join the droplet (the latter argument is assumed). The continuation of the increase in suction pressure plus the volume lost in the dripping step results in the buckling of the interface (Fig 3b red and 3E, also see note [3]). When the authors aspirate the bare oil droplets as well as droplets stabilized by small molecules, they only see the sudden droplet disappearance with no shape abnormalities due to the fluid nature of the interface rather than solid-like nature for the particle-stabilized case. But why does the buckling happen? 


Screen Shot 2017-11-06 at 17.55.45
Fig 3. Evolution of instabilities of a particle-coated droplet under tension. (a) shows the schematics of the particle-coated droplet being aspirated. (b) Change in aspiration length as a function of suction pressure. Blue line remarks the capillary instabilities. Red line shows the elastic failure of buckling process. (c & d) are the images of capillary and buckling instabilities respectively. (e) shows the case when the suction pressure is above buckling pressure at which the particle coat fails (the figure is adapted with no further change from the original paper).

Recall how we defined the net interfacial tension above; \tau=\gamma - \Pi. The authors hypothesize that upon suction of a particle-stabilized droplet, particles jam at the interface of the droplet outside of the pipette, creating a high surface pressure. When this surface pressure approaches \gamma, the net tension becomes zero (\tau=0, see fig 2d and note how the interface tension is opposed by the surface pressure due to repulsion between particles). When an interface possesses no tension, it means that the interface can no longer bear any loads. Considering any sort of defects or irregularities due to nonuniform particle packing, for such interfaces deformations such as buckling will form. Now, let’s see how the authors test their hypothesis.

The authors observed that at the tip of the tongue, there is a very dilute packing of particles in such a way that the interface to a good approximation resembles the Fig 2a, a bare water-oil interface. With this observation, one can safely assume that the interfacial tension, the \tau is equal to the oil/water interface tension, the \gamma and write the Young-Laplace equation across the tip of the tongue (see Fig 1B-(1)): 

            P_{droplet} - P_{pip} = \frac{2\gamma_{0}}{R_{p}}

where R_{p} is the radius of the pipette and is fixed. The authors experimentally show that for a range of droplet size (10\ \mu m < R_{droplet} < 100 \ \mu m), the droplet pressure right before buckling varies very close to zero (in above equation all parameters are known except the P_{droplet}, which is calculated when we put P_{pip} = P_{buckling}). Therefore, considering the equation (2) in Fig 1B, the net tension would be zero (see note [3]) and with this, the authors correlate that the reason for the formation of buckling is the net-zero tension of the interface.

Taking it all together, we saw that for a droplet with solid-like thin shell, the mechanical response is completely different from the bare or the molecule-stabilized interface. A fairly rigid interface undergoes buckling due to its net tension tending to zero and knowing the threshold of buckling will enable us to tune the mechanical properties of such droplets for different applications from load-caused cargo release (see note [1]) or emulsions with varied flow properties. Imagine if we encapsulate a fragrance in our air bubble, which upon rupturing will release the scent. Now, wouldn’t it be nice if we could control the toughness of this bubble or similar architecture to rupture under a specific condition that we desire (see note [1])? 


[1] In a disease called atherosclerosis, the arteries narrow down due to plaque buildup. In this narrow region, the blood pressure is higher than the normal region of the artery. So one can use this pressure difference to crack release the relevant drug from the capsule only in the narrow regions of the artery to dissolve the plaques away. Neat!

[2] If we apply a shear force on a mixture of two or more immiscible liquids in the presence of a stabilizing agent, we produce an emulsion and the stabilizing agent is called an emulsifier. The particles show a significantly higher tendency to gather at an interface in comparison to amphiphilic molecules. Thus, particles are strong emulsifiers. If we mix lemon juice and oil, soon after stopping the mixing, the two solutions will separate. Now, if you add eggs, you stabilize this mixture (egg works as an emulsifier) and you get Mayonnaise!!

[3] The authors report that for particle-stabilized droplets they observed different deformation morphologies such as wrinkles, dimples, folds and in some case complete droplet failure. They attribute this diversity to the non-uniformity of particle packing at the interface. But what is interesting to me is when they decrease the suction pressure, the droplets go back to their original spherical shape and then upon the second aspiration, the deformations happen at the same exact location as were for the first aspiration. This means that during the suction, there is limited particle rearrangement (Watch here).

[4] We can easily set the atmosphere pressure to zero before aspirating the droplets, thus here the P_{atm} = 0.

When espresso evaporates: the physics of coffee rings

Original paper: Capillary flow as the cause of ring stains from dried liquid drops


fig1a
Figure 1. A 2-cm dried drop of coffee with a stain around the perimeter, forming a coffee ring. Adapted from Deegan et. al.

I’ve spilled a lot of coffee over the years. Usually not a whole cup, just a drop or two while pouring. And when it’s just a drop, it’s easy to justify waiting to clean it up. When the drop dries on the table, it forms a stain with a ring around the edges (Figure 1), giving it the look of a deliberately outlined splotch of brown in a contemporary art piece (when I say “coffee ring” I mean the small-scale, spontaneously formed stain around the edge of the original drop, rather than the imprint left on a table from the bottom of a wet coffee cup). But the appearance of these stains is simply a result of the physics happening inside the drop. Coffee is made of tiny granules of ground up coffee beans suspended in water, so the ring must mean that these granules migrate to the edge of the droplet when it dries. Why do the granules travel as they dry? Today’s paper by Robert D. Deegan, Olgica Bakajin, Todd F. Dupont, Greb Huber, Sidney R. Nagel, and Thomas A. Witten provides evidence that coffee rings arise due to capillary flow–the flow of liquid due to intermolecular forces within the liquid and between the liquid and its surrounding surfaces.

contact angle
Figure 2. Diagrams of contact angles for different droplets. From left to right, the first is exhibits poor wetting, with a large contact angle. The next has good wetting, with a smaller contact angle. The last has perfect wetting, with a contact angle of zero, and coffee grains suspended in this solvent would not be able to form a ring upon drying.

The researchers found that these rings don’t just form in coffee. Their observations showed that the rings form in a wide variety of solutes (the suspended coffee granules), solvents (the water), and substrates (the table you spill on) as long as a few conditions are met. First of all, the droplet has to have a non-zero contact angle[1] (See Figure 2). In other words, the droplet doesn’t spread out into a completely flat puddle on the table. Second, the contact line has to be pinned. This means that the surface has irregularities or roughness that cause the edge of the droplet to get stuck in place. Last, the solvent has to evaporate; the ring won’t form if the droplet never dries.

So now we know the conditions required for rings to form, but we want to know how they form. Deegan and his colleagues found that the rings are caused by a geometrical constraint. Here’s how it works: The pinning of the contact line means that the perimeter of the droplet cannot move, so the diameter of the droplet has to remain constant. But if the water in the droplet is evaporating, the droplet’s height will be reduced at every point (Figure 3a). Along the edges, where the droplet is thinnest, the height would be reduced to zero, and the droplet would shrink.

But the contact line pinning means that droplet can’t shrink. To prevent this shrinkage, liquid must flow out to replenish the liquid at the droplet edge as it evaporates. This flow brings with it the suspended coffee granules (or whichever solute is suspended in the solvent), pushing them outward until they pack at the edge of the droplet to form a ring (Figure 3b).

droplet cross sections
Figure 3. (a) Diagram showing the cross-section of a droplet on a surface. The shaded region shows how the droplet will shrink due to evaporation after a small amount of time if the contact line is not pinned. (b) Now, a black line is added to show how the droplet will shrink if the contact line is pinned. The arrows indicate that more liquid must flow to the outside of the droplet to replace what is lost to evaporation. Adapted from Deegan et. al.

By calculating how quickly water evaporates from the surface of a droplet, the researchers derived an expression for the mass of the ring as a function of time. It takes the form of a power law, which can be shown as a straight line on a log-log plot. Equipped with a quantitative prediction, the researchers set about performing experiments to test their model. Instead of using coffee, they opted for plastic microspheres suspended in drops of water. They placed the drops on glass slides and used a video microscope to image the droplets as they dried, recording the particles moving to the edges of the droplet (Figure 4).

video
Figure 4. Particles flowing to the edge of a droplet during evaporation to form a ring. Video from [2] and produced by Deegan et. al.
The researchers knew the mass of the individual particles, so they were able to calculate the mass of the ring as a function of time by counting the particles as they traveled to the edges. The results were shifted by an offset time t0 to account for early times where the power law prediction doesn’t hold and were shifted by mass M0 to account for the particles deposited during this initial stage. From the plot comparing the data and theory (Figure 5), we can see that the prediction shows good agreement with the data.

M vs T
Figure 5. Plot of mass in the ring as a function of time. The mass is plotted in units of particle number, so the plot shows how the number of particles grows over time. The three lines correspond to three different droplets. The upper curve overlapped with the middle so was shifted up for clarity. The circles show data and the solid lines show the theoretical prediction. The slope of 1.37 is the exponent of the power law predicted by the theory; On a log-log plot, a power law is a line with the exponent as the slope. Adapted from Deegan et. al.

In the twenty years since this paper was published, the study of drying droplets has continued in full force [3]. Scientists have discovered various particle patterns that can form under different drying conditions. Why do we care so much about these drying droplets? If the beauty of the physics isn’t motivation enough, then maybe the applications will convince you. The physics of drying is essential to inkjet printing, and a better understanding of the drying process could help make more precise printers [4]. Drying patterns can be used to identify the presence of certain proteins, making this a potential tool for disease detection [5]. Maybe next time you spill some coffee, you’ll take a moment to think of the physics of the drying droplet before you wipe it away.


[1] The contact angle is the angle where a liquid-gas interface meets a solid surface. The smaller the contact angle, the better the wetting of the surface.

[2] https://mrsec.uchicago.edu/research/highlights/coffee-ring-effect

[3] https://www.nature.com/uidfinder/10.1038/550466a

[4] Soltman, D. & Subramanian, V. Langmuir 24, 2224–2231 (2008).

[5] Trantum, J. R., Wright, D. W. & Haselton, F. R. Langmuir 28, 2187–2193 (2012)

Brick-by-brick to Build Tiny Capsules

Original paper: Colloidosomes: Selectively Permeable Capsules Composed of Colloidal Particles


Disclosure: The first author of the article discussed in this post, Anthony Dinsmore, is now my Ph.D. advisor. He did his postdoc at Harvard University a while ago, and consequently, I was never involved in this work.

In past two decades, several approaches have been developed and optimized to encapsulate a wide variety of materials, from food to cosmetics and the more demanding realm of therapeutic reagents. Inspired by biological cells, the first attempts were to use either natural or synthetic lipid molecules to form encapsulation vessels, the so-called liposomes. Then, with the increasing awareness of controlled release of cargo, especially for therapeutic purposes, advanced materials such as polymers were developed to form carrying vessels. There has been an enormous progress in encapsulation technologies, however, these methods can be limited in their applicability regarding encapsulation efficacy, permeability, mechanical strength, and for biological applications, compatibility. In this article, Anthony Dinsmore and his colleagues introduce a new platform and structure to encapsulate almost all types of materials with finely controlled and tuned properties.

Colloidosomes

An emulsion is produced typically by application of a shear force to a mixture of two or more immiscible liquids like the classical water-oil mixture. The resulting solution is a dispersion of droplets of one liquid in the other continuous liquid. In such case, an interface between the fluids exists that would impose an energy penalty on the system. Therefore, the system will always attempt to minimize it, in essence by reducing the area of the interface that is to merge the similar liquid droplets. Amphiphilic molecules are known to segregate in such interface to further reduce the energy and to inhibit the merging of droplets.  This segregation is not limited solely to molecules though. Solid particles tend to jam in the interface for the same reason to stabilize the emulsions. Inspired by the idea of particle-stabilized emulsions, which are known as Pickering emulsions, Dinsmore, and his colleagues have developed capsules made of solid particles. They adopt the name “Colloidosomes” by analogy to liposomes and demonstrate how the arrangement of these particles can be manipulated and controlled to achieve a versatile encapsulation platform.

Fabricating the Capsules

Colloidosomes are prepared first by making the emulsion in which the continuous phase contains the particles. For instance, in water-in-oil emulsions (“w/o”), water droplets become the core of the colloidosomes and particles are dispersed in the oil phase. Gentle agitation of such system results in particles being trapped in the water-oil interface (see Fig.1). The authors summarize the capsule formation in three main steps:


Screen Shot 2017-10-17 at 01.01.10
Fig 1. The colloidosome formation process is illustrated schematically in three steps. (A) a water/oil emulsion first is created through gentle agitation of the mixture for several seconds. (B) Particles are adsorbed to the w/o interface to minimize the total surface energy. Through sintering, van der Waals forces, and or addition of polycations ultimately the particles are locked in the interface. (C)In the end, the particle-stabilized droplet is transferred to water via centrifugation.

(a)  Trapping and stabilization. When the water-oil interface energy surpasses the difference between particle-oil and particle-water interface energy, particles are absorbed to the water-oil interface and become trapped due to the presence of a strong attractive well. This differs substantially from the case where particles were adsorbed to the interface via electrostatics, which requires the droplets to be oppositely charged to attract the particles. The packing of the particles at the interface is adjusted by controlling their interactions. Typically, the electrostatic interaction between particles, due to their surface chemistry, is utilized to stabilize the packing of the particle. For instance, in this study particles are coated with a stabilizing layer which in contact with water turns into a negatively charged layer.


(b)  Locking particles. To form an elastic and mechanically robust shell, the particles must be locked in the interface. This results in an intact capsule that can withstand mechanical forces. One way to obtain such elastic shell is to sinter the particles in place. Sintering is a thermally activated process in which the surface of particles melts and connects them to each other. Upon this local melting, the interstices among particles begin to shrink. With longer sintering times, it is possible to completely block the interstices, which results in very tough capsules with extremely high rupture points.  In this study, particles with 5 minutes of sintering yielded a 150 nm interstices size, and with 20 minutes, almost all the holes were blocked. By using particles with different melting temperatures, the sintering temperature can be adjusted over a wide range; this might be advantageous for encapsulants incompatible with elevated temperatures. Other ways of locking particles are electrostatic particle packing and packing via van der Waals forces. In the former case, for instance, a polyelectrolyte of opposite charge can be used to interact with several particles to lock them in place. In the latter case, for the van der Waals force to be effective, the steric repulsions and barrier must be destroyed so the surface molecules can get close enough for the London forces [1] to be strong.


After the Colloidosomes are formed, through gentle centrifuging, the fluid interface can be removed by exchanging the external fluid with one that is miscible with the liquid inside the colloidosome. In this step, having a robust shell to withstand shear forces crossing the water-oil interface is very important. This process ensures that the pores in the elastic shell control the permeability by allowing exchange by diffusion across the colloidosome shell. Now, with these steps and knowing parameters such as surface chemistry and locking condition, a promising system with characteristic permeability or cargo release strategies can be designed.


Tuning Capsule Properties; Permeation and Release

The most important feature of a colloidosome, as a promising encapsulant, is the versatility of permeation of the shell and or the release mechanisms. Sustained release can be obtained via passive diffusion of cargo via interstices that can be tuned via particle size and the locking procedure. With the mechanical properties of capsules optimized, shear forces can be used as an alternative release mechanism. For instance, minimally sintered polystyrene particles of 60 microns in diameter have shown to rupture in stresses that can be tuned by sintering time over a factor of 10. What makes the colloidosomes even more interesting is that one can choose different particles, with different chemistry, to have an auxiliary response, such as swelling, and dissolving of particular particles in response to the medium. It is also conceivable if one coats the colloidosome with the second layer of particles or polymers to improve or sophisticate the colloidosomes response. The latter can also mitigate the effects of any defect in the colloidosome lattice.

        With this unique platform, Dinsmore and colleagues stepped into the new realm of encapsulating materials of all kind. From therapeutic cargos to bioreactors, the chemical flexibility and even the ease of post-modification would expand the cargo type beyond molecules. For example, the authors show that living cells can be encapsulated in colloidosomes. Well, you may wonder, WHY? Imagine a protective shell around cells that keep them out of the reach of hostile microorganisms without compromising the cell’s vital activities such as nutrient trafficking and cell-to-cell crosstalk. 


[1]  London forces arise when the close proximity of two molecules polarizes both molecules. The resultant dipole work as a magnet to glue molecules together. Therefore, London forces are universal forces (and part of van der Waals forces), which takes effect when atoms or molecules are very close to each other.