Imagine you and your friends are trapped by a super-villain in a cage. There is a giant gear with a diameter half the length of a football field in the center. The only way to open the cage door, get out, and stop the villain’s evil plans will be to rotate this gear by one full revolution. This is a daunting task for one person — but if you have enough friends, you can grab the gear’s teeth and push it together to escape. An analogous task is faced by flocks of tiny bacteria in today’s two featured papers. In “Bacterial ratchet motors”, Di Leonardo and colleagues discuss the mechanics of bacteria pushing a single gear, and in “Swimming bacteria power microscopic gears”, Sokolov and colleagues discuss how bacteria can interact to power more than one gear.
Two types of bacteria were used in these studies — B. Subtilis and a harmless strain of E. Coli. A single bacterium is tiny, with a pill-shaped cell body only a couple of microns in length. One bacterium has no hope of pushing a gear one hundred times its size. It swims around in a random, “run-and-tumble” motion. During a “run” the bacterium swims straight. It then stops and “tumbles”, changing its direction randomly, and then swims straight, or “runs” for a while longer. While bacteria swimming together in large aggregations can align and make interesting flow patterns, up to now their motion has been hard to harness to provide useful work. If this technique were perfected, bacteria-powered gears could be used to power micro-devices, such as very small robots, without using an external power source.
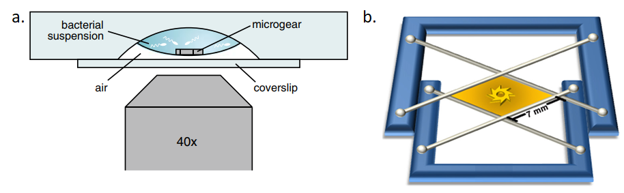
The bacteria used in both studies swam in a liquid medium, which contained the nutrients and oxygen that they need to survive, together with one or two gears. In both of today’s articles, the gears were resting on the bottom of the liquid medium suspended above air. In Di Leonardo’s study, the drop of medium hung from a concave part of a glass slide with 48-80 micron diameter gears; in Sokolov’s study, the medium was stretched in a film between two wires with 380-micron diameter gears. The two setups are shown in Figure 1.
Figure 1: A gear within a bacterial suspension. Di Leonardo’s setup is shown in (a), with the gear suspended above a coverslip. Sokolov’s setup is shown in (b), with the gear suspended in a film. Figures adapted from original articles.
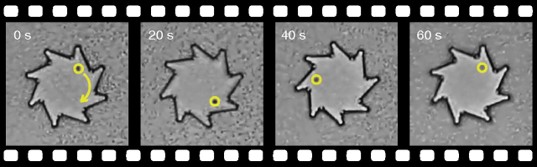
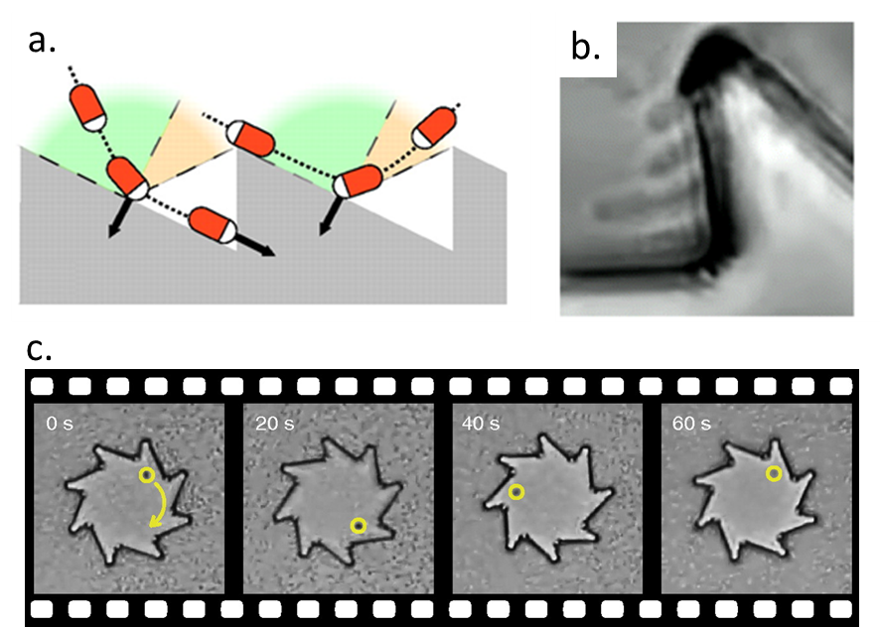
A swarm of bacteria can’t push just any kind of gear. Di Leonardo and colleagues show that if the gear is symmetric, the bacteria can’t rotate it. In this case, there will be an equal chance of bacteria pushing on the left and the right of the gear tooth, not generating an overall rotation. To generate continuous spinning, more bacteria need to push on one side of the tooth than the other. To achieve this, the gears had asymmetric teeth, as in Figure 2a. When bacteria swim towards the corner (like the left bacterium in Figure 2a), they get stuck in the corner. The bacteria can’t escape by swimming straight, so they rotate the gear until “tumbling” and breaking free. When bacteria encounter a tooth while swimming away from the corner (like the right bacterium in Figure 2a), they swim straight off of it. This way, the gear only rotates in one direction. When several bacteria are trapped in the same corner, they spontaneously align and push the gear together, as shown in Figure 2b. This results in a larger force on the gear. The rotation of a single gear is shown in Figure 2c.
Figure 2: Results from Di Leonardo’s paper. (a) A bacterium (represented by red rods with white heads) rotates a gear by getting stuck in a corner. Arrows represent reaction forces experienced by the gear as the bacteria hit it. The green areas and the red areas show the angle of approach when a bacterium is guided towards the corner or not. (b) Four bacteria pushing against a single tooth at the same time. (c) Bacteria spinning a gear at 1 rpm.
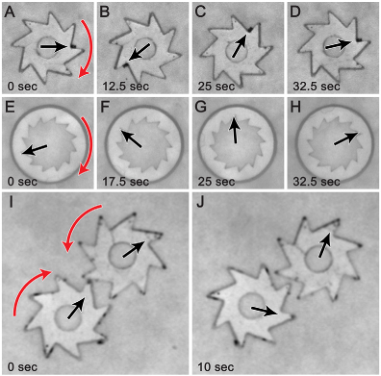
Sokolov and colleagues investigated different shapes and arrangements of gears. They showed that gears with teeth either on the inside or on the outside will rotate, as in Figure 3, A-H. They then added a second gear for bacteria to spin. If two gears are close enough to each other, then their teeth ‘catch’ as in Figure 3, I and J.
Figure 3: Time lapses of bacteria pushing gears with teeth on the outside (A – D), teeth on the inside (E – H), and two gears at once (I and J). Red arrows correspond to the spinning direction of the gear and black arrows point to the tracked spot on the gear. Image from original article.
Bacteria turning a gear are an example of a non-equilibrium system. A system at equilibrium doesn’t consume any energy and doesn’t produce useful work. This might be surprising, but if a gear was placed in an equilibrium system, such as atoms in a gas, it would never rotate. An atom encountering a wall or a corner of a gear will simply bounce off, and the net torque produced by all the atoms bouncing off the gear is zero, no matter what shape it is. The difference between atoms in a gas and bacteria in a fluid is that bacteria have their own internal source of energy, and hence are not at thermodynamic equilibrium. A “running” bacterium will not just bounce off of the wall of a gear corner. Instead, its swimming will rotate the gear by the corner until the next time the bacterium “tumbles” and reorients.
Are gears rotated by bacteria actually a useful system? Sokolov and colleagues estimate that the power generated by the bacteria is $latex 10^{-15}$ watts. Most electronic components, such as the ones in a cell phone, require power on the order of $latex 10^{-6}$ watts. These bacteria are not — as yet — generating nearly enough power for real-world machines. Although the rotation of the gear is not powerful enough to be useful, it is amazing that such small creatures are able to do so at all.
Are you afraid of visiting the dentist? If so, you’re probably not the only one, but unfortunately we can’t avoid it. Yearly dental check-ups are necessary to prevent tooth and gum infections. Dentists use a disturbingly sharp, noisy tool to remove dental plaque from the tooth surface. Dental plaque is caused by bacteria, and it is an example of a biofilm, which is a community of bacterial cells that stick to surfaces. Biofilms can be found everywhere, especially on wet surfaces. Biofilms cause health problems for millions of people worldwide every year, primarily because of infections during surgery or consumption of contaminated packaged foods. To prevent these problems, some scientists are developing surface coatings that will prevent biofilm formation in the first place. In this week’s paper, we will learn about a new technique for creating a microscopic “shield” against the formation and growth of biofilms.
A biofilm is a complicated microscopic world in which multiple bacterial species can coexist. Most parts of the biofilm are covered by a protective sticky slime that is produced by the bacteria themselves. It is now known that bacteria communicate with each other within the biofilm by exchanging small molecules, proteins, genes, and even electrical signals. This intercellular communication results in expression of specific genes throughout the bacterial community in response to the environment. As a result, bacteria in biofilms are able to quickly develop resistance to antibiotics, making the treatment of biofilm infections extremely challenging. Therefore, one of the most common ways of destroying biofilms is a mechanical removal by scraping. This explains why we can’t avoid going to the dentist at least once per year; a toothbrush is not strong enough to remove the biofilm layer that we know as dental plaque.
Figure 1. A culture of E. coli growing. Video courtesy of en.wikipedia.org.
Unfortunately, scraping is not always possible; especially in cases where biofilms are formed at surfaces inside the body or on tiny surgical and industrial tools. Li Li and co-workers from the Technical University of Denmark, in collaboration with the Nanyang Technological University in Singapore, developed a coating material with the ultimate goal of preventing the growth of multiple bacterial species. This material has a structure with many nanoscale pores (holes) able to load and release antimicrobial compounds. For this study, it was filled with a detergent compound that is part of household cleaning products and is known to kill bacteria by dissolving the bacterial cell membrane. The researchers loaded the nanoporous polymer films with the detergent and placed the films in contact with Escherichia coli (E. coli) biofilms. Before showing what happened to the E. coli biofilms, let’s discuss a little bit more about the nanoporous polymer film.
Figure 2. The periodic gyroid structure of the nanoporous polymer films. Video courtesy of en.wikipedia.org.
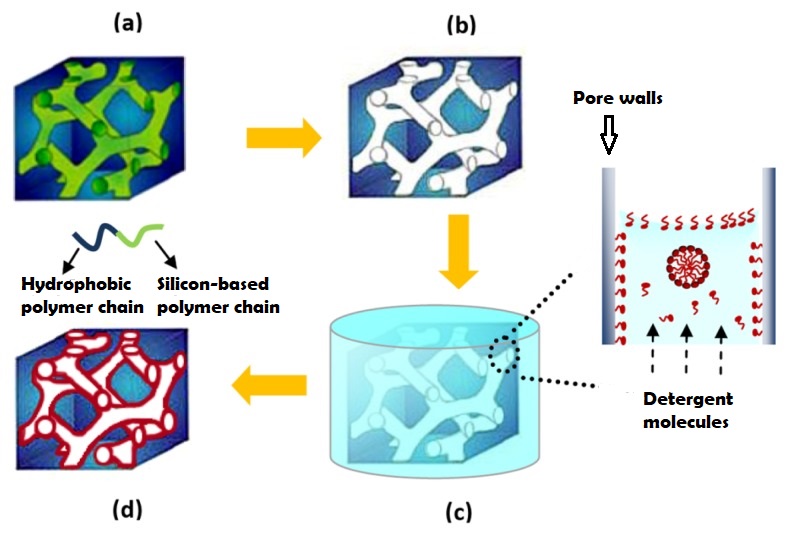
The nanoporous film used in this study is made of a polymer that has two hydrophobic (water-repelling) chains, one of which is a silicon-based material that we use in contact lenses. The polymer chains self-organize into the beautiful gyroid structure shown in Figure 2, which is a 3D interconnected surface that repeats in three directions (is triply periodic) and contains no straight lines. The most beneficial part of this structure is that it forms small, nanoscale pores after the removal of the silicon-based chains, which provide large storage space for the detergent molecules. To stabilize the final structure used in this study, the researchers add a chemical compound to remove the silicon-based chains. At this step, the interconnected polymer chains form strong covalent bonds with each other, a process called cross-linking. Figure 3 shows the process of the nanoporous film preparation (a, b) and loading of the detergent (c, d) (to learn more about the preparation, see [1]).
Figure 3. Representation of making the nanoporous polymer film and loading it with detergent by diffusion: (a) the block copolymer re-organizes into a gyroid structure, (b) the silicon-based polymer chains are removed from the nanoporous film, (c) The detergent solution is in contact with the nanoporous film and the detergent molecules attach to the pore walls (the enlargement shows that excess free detergent molecules may form small spheres between the walls), (d) the final nanoporous film loaded with detergent (red color represents the detergent layer). (Image adapted from Li Li’s paper).
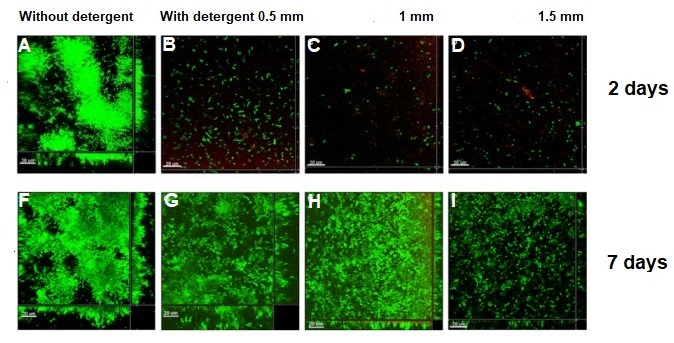
What happened to the E.coli communities after being in contact with the nanoporous film loaded with detergent? The researchers tested three samples of films differing in thickness (0.5mm, 1mm, and 1.5mm). They took microscopic images after two days and after seven days of contact with the bacteria. These specific periods were chosen because it is known that within three days almost 70% of the detergent can be released from the nanopores. To compare, they also included a nanoporous surface without detergent, which is shown in Figure 4, parts A and F. On the samples without detergent the bacteria were free to grow into large biofilms. The results in Figure 4 show the astonishing difference between the biofilms with, and without contact to the detergent after two days. Only a few small areas of live bacteria (green spots) were visible on the films with detergent, and even some dead bacteria were visible (red spots). The nanoporous surface worked! In addition, thicker nanoporous surfaces were even more effective against biofilm growth, because they have more pores loaded with detergent.
Figure 4. Images of the 2-day (A–E) and 7-day (F–J) biofilm formation by Escherichia coli on nanoporous films with (B–E, G–J) and without (A, F) detergent. Green and red cells correspond to live and dead cells, respectively. (Image adapted from Li Li’s paper).
The tests after seven days were not as successful for the thinner films, which means most of the detergent was released from these films in less than seven days. Interestingly, the thickest nanoporous film was still effective at preventing biofilm growth after seven days. The researchers also tested the material on biofilms made by another type of bacteria, Staphylococcus epidermidis, which has a different type of cell wall. The results were not successful, and the biofilm kept growing, showing that the particular detergent is not effective in killing this type of bacteria. This shows the challenges researchers are facing, such as releasing antimicrobial compounds for longer periods of time and preventing the growth of specific bacterial species.
To conclude, this study showed that these gyroid nanoporous surfaces are effective in delivering detergent to prevent the formation and growth of E.coli biofilms. The researchers recommend further experiments with different types of detergents to target more species of bacteria. Of course, we can’t use detergents for applications in the body (detergents are highly toxic), but it is possible these nanoporous films could be used to deliver other non-toxic, antibacterial molecules. The research on the fight against biofilms keeps going! But you still have to visit your dentist every six months.
No one likes being stuck. Whether you are in a car stranded in mud or stuck in a dead-end job, continuing normal behaviour is unlikely to help. Whereas we can see approaching hazards and dead-ends and try to avoid them, bacteria must blindly swim through passageways and channels that are of a similar size to themselves, often resulting in the cell becoming trapped. So, how does a bacterium change its behaviour to free itself?
In today’s paper, Kuhn and colleagues report a new type of bacterial motion used to escape from microscopic traps. Like the car stuck in slippery mud, forward-reverse strategies do not free the cell. The bacteria adopt a new swimming setup wherein their swimming appendage is wrapped around the cell body. This new coiled swimming was only discovered in 2017 and currently has only been observed for two bacteria species [1].
For bacteria, which are only a couple of micrometres, the viscosity of the swimming media dominates over any inertial effects. When we swim in water inertia dominates, so we can move to some extent with only one propelling action. However, when there is no inertia, if you stop propelling, you will immediately stop moving. To overcome the limits of their drag dominated environment, many bacteria use thin appendages called flagella.
Bacteria flagella are the only natural structures that generate propulsion via rotary motors. Much like a boat propeller, the bacterial flagellum has a rotary motor at its base, embedded in the cell body that rotates its propeller 100 times a second. However, the bacterial propeller is different from propellers we recognise. The bacteria flagella has two components: the flagellar filament and the hook. The flagellar filament is a helix, 1-3 times the length of the bacterium cell body, and the hook is a nanometre scale elastic segment connecting the filament to the rotary motor. Like a corkscrew, the rotation of the helix creates motion along the helix axis. Both the handedness of the helix, that is which direction the helix curls around its axis, and the direction of rotation determine whether a corkscrew goes forwards or backwards. Typically the bacterial flagellar filament is left-handed and rotates counterclockwise, looking from the end of the flagellum to the cell body, thus pushing the bacterium cell first at about 20 cell body lengths per second. If the same left-handed helix rotated clockwise, the bacterium would swim backwards – filament first – towing the cell body.
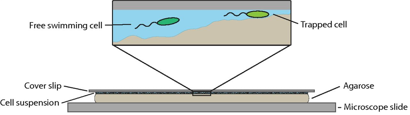
Fig. 1: The experimental setup. The bacteria swimming in a small microstructured environment created by the uneven gel surface. The bacteria rotates its helical propeller counterclockwise transitioning from a free swimming cell to a trapped cell as the bumpy surface come closer to the above thin glass slide. Figure adapted from Kuhn et. al.
To recreate a bacterium’s natural environment, Kuhn and colleagues cover an uneven gel surface by a thin film of liquid with a thin glass slide above, as shown in Figure 1. The varying distance between the bumpy gel surface and the thin glass slide provided a micro-structured environment in which the bacteria could be observed. Their study focuses on a genetically modified soil bacteriumthat has a single flagellum placed at the end of a pill-shaped body a couple of micrometres in length. By watching the rotation and position of the fluorescently stained 20-nanometre-thick flagellar filament, they are able to determine when the bacterium is stuck and how structural changes enable its escape.
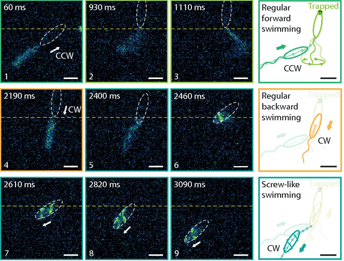
Fig 2: Approach, trapping and escape. Top row: the bacterium becomes trapped during regular forward swimming. Middle row: backwards swimming is not able to free the cell. Bottom row: the flagellar filament wraps around the cell body and the bacterium is able to reverse to escape the trap. Figure adapted from Kuhn et. al.
Compared to the free-swimming cell in a bulk solution, swimming close to surfaces increases the drag on the bacterium. The cell is trapped when the surfaces are close enough to increase the drag on the cell head above the thrust. To attempt to free themselves, the bacterium switches between clockwise and counterclockwise flagellar rotation – a forward-reverse strategy. This is unsuccessful. A successful escape only occurs when the flagellar filament wraps itself around the cell body, creating a conformation that has not been seen before. The wrapped filament is still helical, so rotation of the motor still creates propulsive forces along the helix axis. The cell then swims in a screw-like motion to release itself, as seen in Figure 2. It is yet unclear why exactly the coiled state enables the bacterium to escape. It could be the change in helical structure, the proximity of the flagellar filament to the cell body or the interaction of the flagellar filament with the nearby surface or even a combination of these fluid drag effects. Once the cell is free, the filament returns to its non-coiled state and normal swimming resumes. But how does this stiff inactive filament change its shape so drastically?
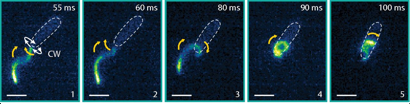
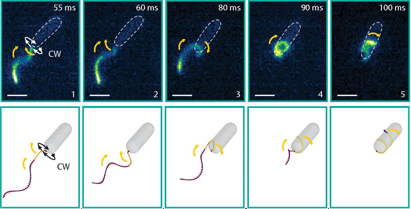
Fig 3: Flagellar filament transformation. The flagellar filament changes shape sequentially from the base of the helix to the top. The top row shows the experimental images with scale bar 1µm, and the bottom row shows computer simulations with the two different colours of the flagellar filament relating to the two different atomic configurations observed. Figure adapted from Kuhn et. al.
To induce the new swimming state in a bulk fluid environment, the researchers study the bacterium freely swimming in solutions of increasing viscosity. The increased viscosity increases the force on the flagellum and was observed to increase the likelihood of the screw-like motion. The increased forces on the flagellar filament thus seem to be responsible for the drastic change in state. Changes in the helical structure are well known for other flagellated bacteria changing the diameter and even the handedness of the helix, but never as extreme as to wrap the flagellum around the cell.These well-known flagellum changes are due to a change in the atomic structure of the flagellum, so rather than bend elastically, the filament changes shape sequentially along the flagellar filament. As the researchers’ bacterium’s filament is constructed similarly, they ascribe their two swimming types to two atomic configurations available to the flagellum: one normal and one coiled, as shown in Figure 3. Although the coiled swimmer is much slower than the uncoiled swimmer when freely swimming, the coiled state is able to free the bacterium from micro-structured traps, giving the bacterium a significant advantage.
Understanding this new type [1] of bacterial motion is critical to know how a bacterium survives in its natural habitat. For which habitats is the screw motion most common? Are there many more species that can coil to recoil? Where does this screw motion fail? What are the key features of the wrapped state that allow the bacterium to escape? Not only will studying these features help to understand populations of bacteria, for example how they spread and find better habitats, but it could also help in the design of micro-robots within complex environments such as for targeted drug delivery in the body.
[1] The same wrapped swimming configuration has also very recently been observed for a multi-flagellated bacterium, P. putida [you can see the paper here]. This bacterium has 5-7 flagella positioned at one end of the cell. Contrary to the results described above, the transition was observed for cells swimming in a bulk fluid environment. In the coiled state, all 5-7 flagella wrap around the cell. Through modelling the different swimming states of the cell, Hintsche and colleagues show an increased diffusion of populations that are able to transition to a coiled state.
The next time you’re washing your hands, start by turning the water on just a little. Notice how clear is the flow of the water from the tap. There aren’t any bubbles in the water, and when you put your finger in the stream, it smoothly flows around it. This is called laminar flow. Now keep increasing the water flow until it is very fast and rough. The chaotic nature of the flow in this stream is called turbulence, and how a flow turns from being laminar to turbulent is a popular area of research. In general, turbulent flows are very fast and are made from fluids that are not very thick.
In today’s study, Dunkel and his colleagues investigate how bacteria can make flow patterns that look turbulent – chaotic and full of vortices – even though bacteria are tiny and slow. The bacteria push the fluid around as they swim and create vortices, spinning regions in the fluid. The 5 ?m long bacteria create vortices with diameters of 80 ?m by swimming at the speed of 30 ?m/s!
To determine whether a fluid flow is turbulent or laminar, the Reynolds number, a ratio of the strength of the flow (inertial forces) to how much the fluid resists motion (viscous forces) is used and defined as [1]:
$latex Re = \frac{\rho V D}{\mu}$
It depends on the fluid density ?, flow speed V, the length of an object D (for example, the diameter of a bacterium), and flow viscosity, or thickness, ?. When the Reynolds number of a flow is high, the inertia of the fluid (how powerfully it flows), is much higher than its viscosity (how thick the fluid is). In this case, the resistance of the fluid to small fluctuations in its motion is not enough to prevent the fluctuations from growing and spreading. Before you know it, your previously smooth, easily predictable flow is chaotic and full of vortices – it has transitioned to turbulence.
Typically, flow in a pipe like that in a tap becomes turbulent at a Reynolds number of 2300; the flow of air over an airplane begins transitioning when the Reynolds number is about a million. Bacteria are so tiny and slow that their Reynolds number is very small – on the order of $latex 10^{-5}$.
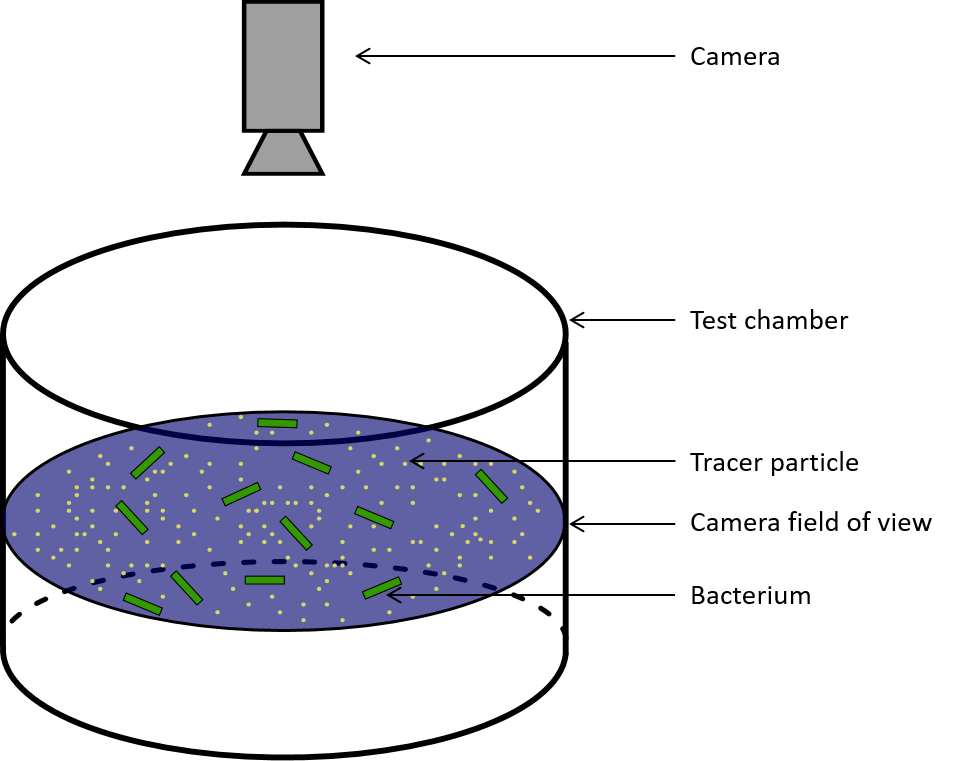
The researchers in this study investigate turbulent-like fluid behavior caused by swimming bacteria, B. Subtilis, in a fluid. B. Subtilis is a rod-like bacteria that swims by pushing its surrounding fluid with its flagellum (or tail). The researchers grew the bacteria in a nutritious fluid medium, and they added small, 1 micrometer beads to the fluid to act as tracer particles. When tracer particles are added to a fluid, you can see them being pushed around by its flow. If the particles are small enough, tracking them can be used to show how the fluid is moving. Thus, the experiment consisted of a suspension (a mixture in which particles do not dissolve) of bacteria and particles in the fluid.
The researchers loaded this suspension into sealed microfluidic cylindrical chambers with a 750 ?m radius and 80 ?m height (Figure 1). Since the chamber was sealed, the bacteria grew tired and did not move as much as they ran out of oxygen, so their activity levels decreased during the 10 minutes they spent in the chamber. Thus, by waiting several minutes between sets of measurements, the researchers were able to test how the bacteria affected the fluid at different energy levels.
The researchers took high-speed 2D videos of slices of the suspension containing the bacteria and the particles in the middle of the cylinder (even though the motion of the bacteria was in 3D). They used visible light to illuminate the motion of the bacteria and fluorescent light to view the motion of the tracer particles through a microscope.
.
Figure 1: Bacteria and tracer particles in the field of view of the camera. Although the entire test chamber is filled with fluid, only the 2D cross-section in the center of the cylinder is in focus.
The researchers used two methods to measure the motion of the suspension of bacteria and particles. First, by monitoring the motion of the bacteria, they obtained vectors showing how the bacteria were moving. Trajectories of bacterial movement were calculated by comparing the position pattern of the bacteria from one image frame to another. In the second approach, they tracked the motion of the particles in the flow by comparing the actual position of the particles from one image frame to the next. The researchers used both methods (monitoring patterns of bacterial motion and tracking individual particle positions) to make sure the flow fields measured from bacteria were an accurate representation of the flow. Since the tracer particles used by the researchers were very small, with diameters of 1 micrometer, they were small enough to be reliably pushed by the flow.
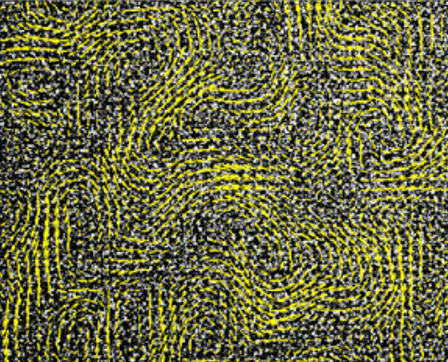
The typical results the researchers got are shown in Figure 2, with visible vortices.
Figure 2: Velocity vectors of bacterial motion superimposed on the image of the bacteria. Figures are adapted from Dunkel and colleagues.
The researchers measured the velocity distributions of the bacteria. They found that the results from the tracer particles and the bacteria had the same distributions – the flow of the bacteria and solvent were very similar, and the flow of the bacteria could be used to represent the fluid flow. However, it is possible that the particles were pushed around by the bacteria, and not by the motion of the fluid itself, which is not mentioned in the paper.
To analyze the average motion of the bacteria, the researchers calculated various properties of the velocity field. They calculated the vorticity, $latex \omega_z$, or how much the bacteria rotated the fluid. The average of the square of the vorticity throughout the 2D experimental plane is called the enstrophy, $latex \Omega_z$. They then calculated the kinetic energy of the flow, $latex E_{xy}$, the energy a fluid has because of its speed, and also calculated its average throughout the space (1). Although the instantaneous kinetic energy and vorticity fluctuated as the bacteria moved, the average kinetic energy and enstrophy over time were approximately constant throughout the 50 seconds of recording.
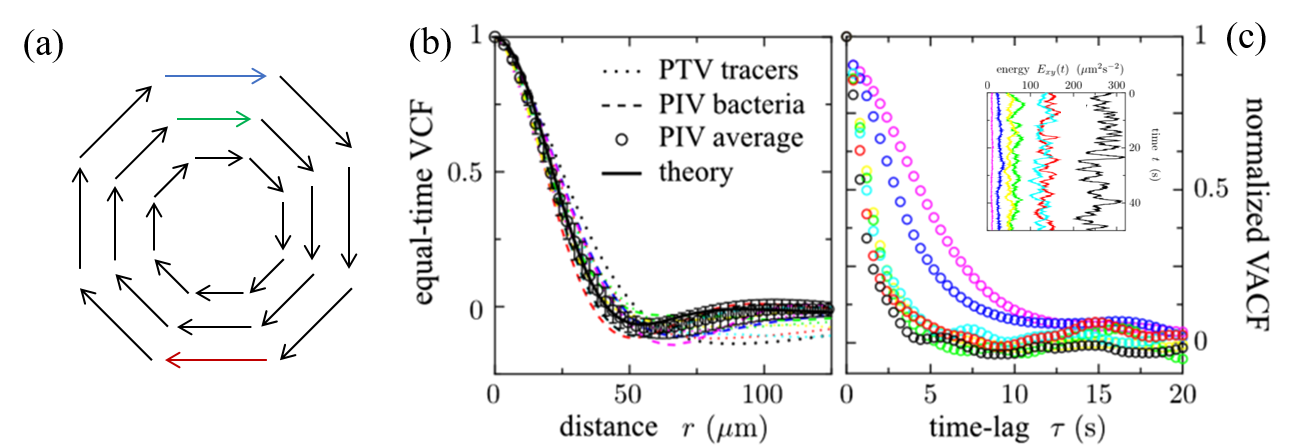
The researchers then measured two properties of the flow with functions called the VCF (“equal-time spatial velocity autocorrelation function”) and the VACF (“two-time velocity auto-correlation function”). The first function, the VCF, measures how the velocity of the fluid changes throughout the space (the 2D slice of the cylinder). If this function goes from positive, velocities in the same direction, to negative, velocities in different directions, then it indicates that there is a vortex in the fluid (Figure 3a). The results of the VCF are shown in Figure 3b. The researchers calculated that the radius of a vortex in the fluid was $latex R_v = 40 \mathrm{\mu m}$ from the VCF. The vortex radius did not change with the kinetic energy of the flow.
The average enstrophy was found to be linearly proportional to the time-averaged kinetic energy by about half the vortex radius ($latex \Lambda = \mathrm{24 \mu m}$) over all the energy scales tested:
So when bacteria have more energy, the fluid has a higher tendency to form vortices and rotate (but the vortices will be the same size).
The second property the researchers calculated was the “VACF”. The VACF measures how the velocity changes over time. The VACF represents the memory of the fluid. If it decays to 0 slowly, that means the velocities stay similar for a long time; if it decays quickly, the velocity changes in a very short time. The results of the VACF are shown in Figure 3c. The researchers found that at higher energies, the system has a shorter “memory”. The VACF shown in black has the highest energy, and decays much faster than the VACF shown in purple, which has the lowest energy. In bacterial turbulence, bacteria add energy to the system by swimming to make small vortices, which then lead to larger vortices. This is the opposite of how vortices form in a non-active turbulent fluid, where the energy is added to the larger vortices that create smaller vortices because of the fluid’s viscosity.
Figure 3. (a) Diagram of a vortex. The blue and green vectors are correlated (positive VCF), showing that there is no vortex between them; the blue and red vectors are anticorrelated (negative VCF), showing the presence of a vortex. VCF (b) and VACF (c) of the bacterial motion. The minimum value of the VCF indicates a vortex with a 40-micron radius. The VACF varies with energy when plotted as a function of the time lag. Inset: energy as a function of time; the black spheres show the highest energy and data in purple is at the lowest. Figure modified from the original paper.
Finally, the researchers present a recently developed theory for the flow caused by bacteria. This theory is a continuum model equation – it treats the suspension of fluid, bacteria, and particles as if it were a continuous material, and accounts for the effects of the fluid flow and the forces the bacteria apply to the system.
The equation in the theory can be modeled to predict how the suspension will move. If the parameters of the equation in this theory are chosen to represent flow without bacteria, it simplifies to a theoretical fluid flow model. The researchers chose coefficients in the equation known to represent bacteria that push the fluid, like B. Subtilis in this experiment. They found that the model was accurate to within 10%-15%, making it a good candidate for a quantitative description of bacterial turbulence.
In today’s paper, Dunkel and his colleagues made significant contributions to the understanding of bacterial turbulence. The researchers developed a method to show that the motion of the bacteria swimming in a fluid can be used to measure the motion of the fluid itself. They developed a mathematical model of the motion and tested it with their experimental results to create a method for quantitatively studying how bacterial motion affects fluid flows. The observations they made can be used to compare bacterial turbulence to traditional turbulence in fluid mechanics, and give insight into how other fluids with active particles might behave.
[1] Fox, Robert W., Alan T. McDonald, and Philip J. Pritchard. Chapter 2, Introduction to fluid mechanics. Vol. 5., New York: John Wiley & Sons, 1998.
[2] Dunkel, Jörn, et al. “Fluid dynamics of bacterial turbulence.” Physical review letters 110.22 (2013): 228102.
(1) The vorticity, $latex \omega_z$, is calculated by taking the difference between the change in the y-component of the velocity, $latex v_y$, in the x-direction and the x-component of the velocity, $latex v_x$ in the y-direction:
The average kinetic energy (represented by angle brackets is calculated as:
$latex E_{xy} = \frac{v_x^2+v_y^2}{2}$
As the mass of the bacteria was constant, the energy depends only on the measured velocities of bacteria, and mass was not included in the calculation. As you may remember, a range of energies was tested by varying the bacterial activity.
The enstrophy, $latex \Omega_z$, is calculated as the average of the vorticity as: