Plants detect gravity by going with the (granular) flow

Original paper: Gravisensors in plant cells behave like an active granular liquid

Content review: Adam Fortais
Style review: Heather S.C. Hamilton


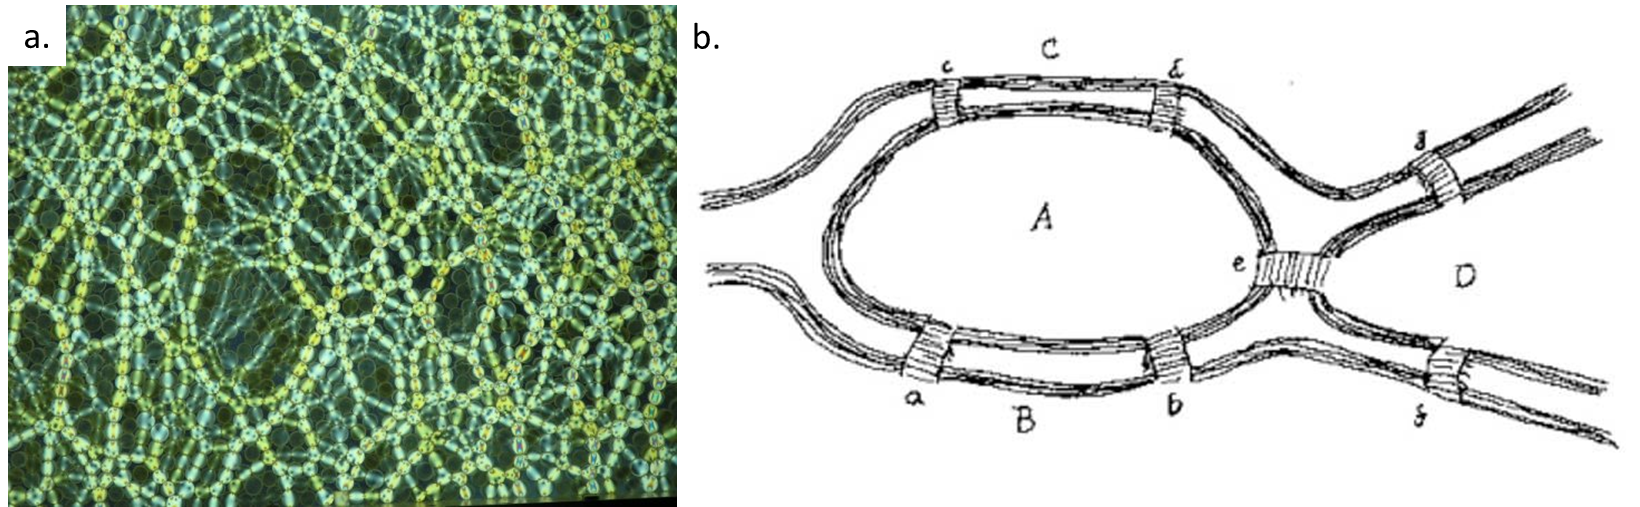
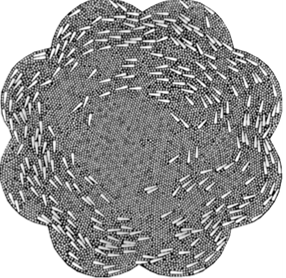
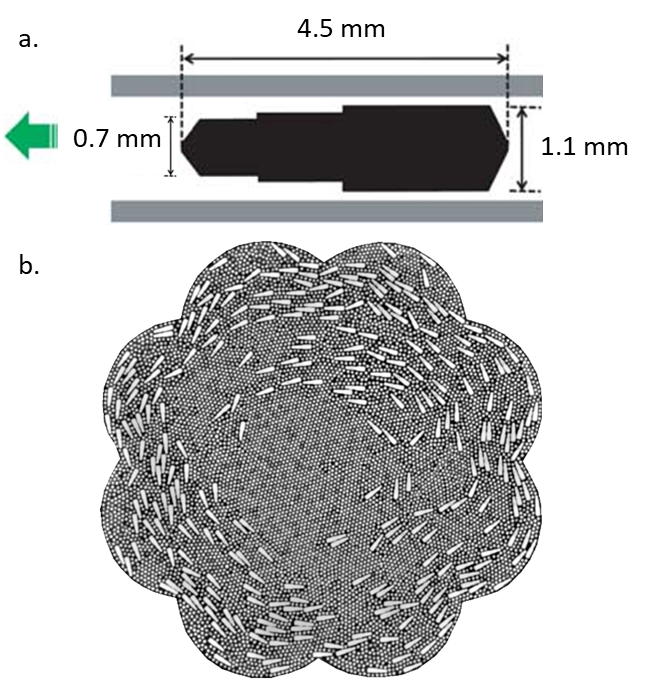
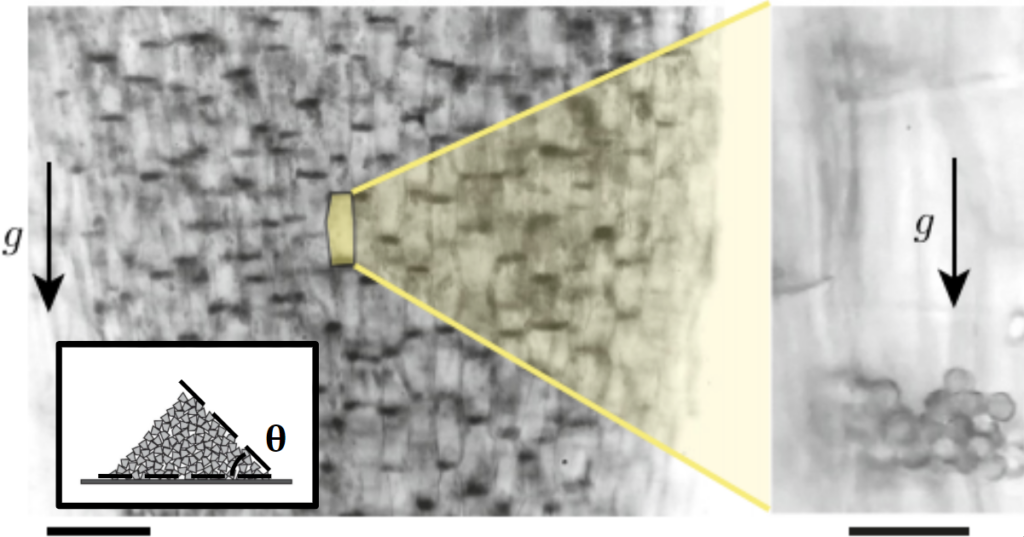
Plants need to know the direction of gravitational pull in order to grow their roots downward and their stems upward. This information is crucial whether the plant grows in your garden, on a cliffside, or even on the International Space Station [1]. While it’s been said that it took a falling apple for Newton to figure out how gravity works, our photosynthetic friends use a more intricate microscale sensor to detect gravity. This sensor consists of starchy granules called statoliths which can be found on the bottom of specialized cells called statocytes. An accumulated pile of around 20 statoliths at the bottom of a statocyte cell is shown in Figure 1. If the cells are tilted like in Figure 2, the pull of gravity initiates a statolith avalanche that indicates the direction of gravity. The position of statoliths is part of a complicated signaling network that tells the plants how to correct its growth towards or against the direction of gravitational pull. 

Figure 1. Microscope images of statolith piles in gravity-sensing statocyte cells of wheat coleoptiles, which are the sheaths covering an emerging shoot of wheat. Arrows indicate the direction of gravity. (Left) Statolith piles are visible as dark areas on the bottom of the cells. The scale bar represents 100 µm. (Right) Close-up view of the statolith piles. The scale bar represents 20 µm. Images courtesy of the original article. Inset: Standard granular pile just below the avalanche angle. Schematic courtesy of Andreotti et. al., Granular Media Between Fluid and Solid.
Figure 2. Movie made from microscopic images of statolith avalanches in wheat coleoptiles after the cells are tilted 70 degrees. Statolith piles are dark spots. Movie runs at 40x speed for a total duration of 10 real minutes. Courtesy of the original article.

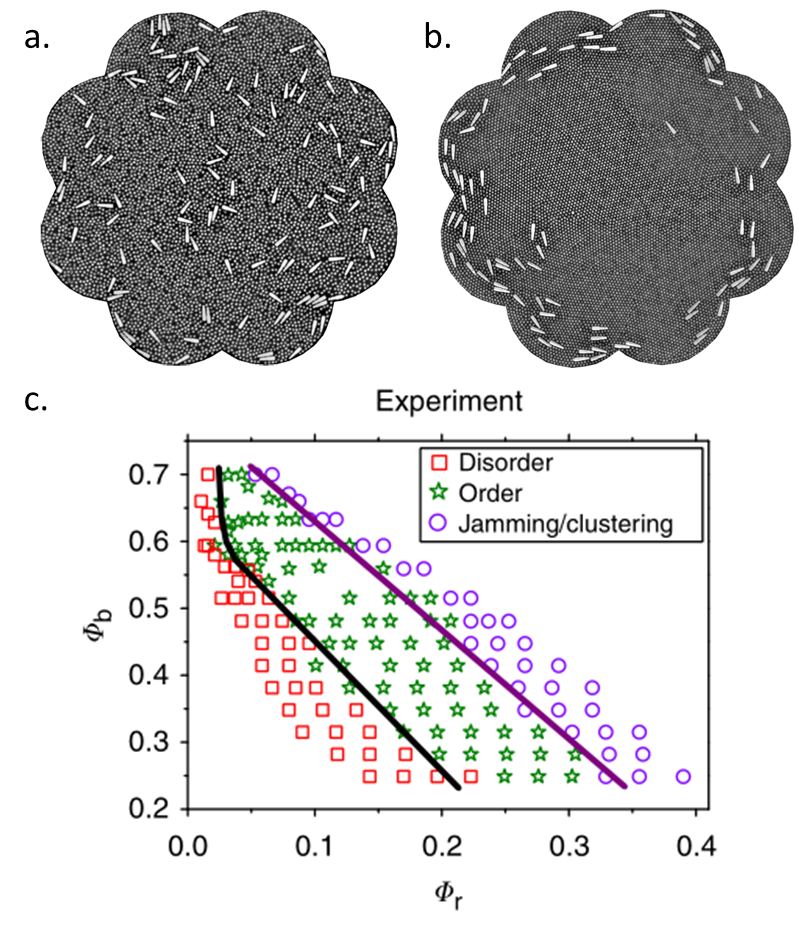
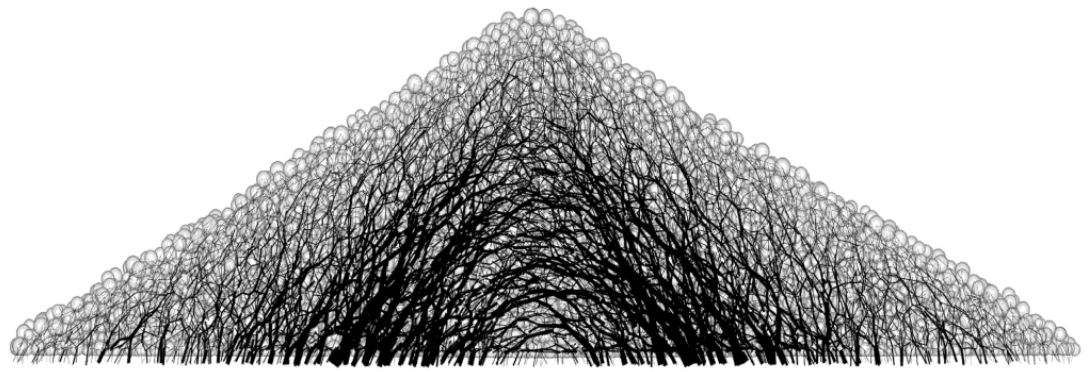
However, Bérut et. al. realized that this description of statolith piles didn’t totally agree with our knowledge of granular materials. There are two major issues. First, granular piles are known to initiate avalanches only when the slope of the pile reaches a critical angle, usually between 5° and 30° depending on the characteristics of the grains. In the case of the statoliths, the critical angle was found to be around 10°. When the slope is lower than the critical angle, the pile should be completely immobile due to frictional forces between the grains. However, plants are able to detect even the slightest changes in gravity — involving angles much smaller than 10° — indicating that avalanches are not the whole story. Secondly, upon tilting as in Figure 2, the grains seem to avalanche until they establish a flat surface layer. This is in direct contrast to classical granular materials. If statoliths behaved classically, we would expect them to avalanche until the critical angle of 10° is reached, rather than their actual final angle of around 0°. How can we explain the shocking sensitivity of these granular piles?

Figure 3. (A) Two observed dynamical regimes in the averaged angular decay of statolith pile slopes over time. Each curve corresponds to different initial inclination angles. (Inset) Initial and final configurations of a statolith pile after being tilted by 70°.  (B) Close-up video of a statolith avalanche (when tilted 15°)  highlighting the random motion of individual statoliths. Movie is played at 80x speed, for a real duration of 14 minutes. Images and video courtesy of the original article.

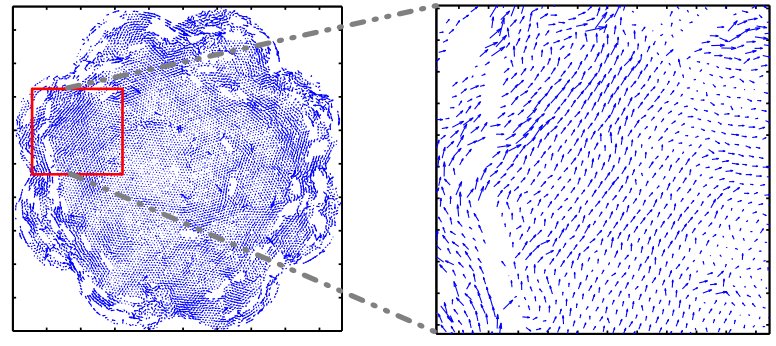
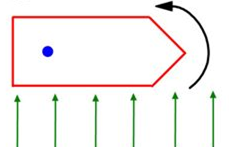
By studying the flow response of the statoliths to gentle inclinations, Bérut et. al. found that the statoliths in fact flow, liquid-like, from a pile into a puddle with or without prior avalanches!  Figure 3A shows a statolith pile angle slowly creeping from 10° (or less) to 0° in 10-20 minutes. This creeping response occurs at any slope. Under the microscope, the statoliths are seen to vibrate, with each individual statolith undergoing random motion shown in Figure 3B. The statoliths are agitated, the origin of which is likely biological processes within the cell rather than random thermal motion, as thermal energy is too small to drive the observed grain activity. While we know that classical granular piles do not flow below the critical avalanche angle, this is not the case for active granular materials. Agitation allows the grains to free themselves from the pile, turning an otherwise static mountain into a fluid-like substance. Long before we had an understanding of the physical world, nature was already building and refining amazing biological machines. We have only recently begun to understand the properties of agitated granular materials, meanwhile plants have been using active grains to detect gravity all this time. Given plants’ long-time expertise with gravity, perhaps the apple that fell on Newton’s head was nature’s way of telling humans to hurry up and figure it out. 

 [1] NASA Plant Gravity Perception Project

The trajectories of pointy intruders in sand

Original article: Collisional model of energy dissipation in three-dimensional granular impact

An alien spaceship commander was preparing to drop a cone-shaped spy shuttle into the sand of a Florida beach near Cape Canaveral. The shuttle needed to burrow deep enough that any passing humans wouldn’t see it while the aliens used it to spy on Earth’s space program. “From how high should I drop the shuttle so that it is hidden?” the commander asked their science advisor. The science advisor pulled out their alien high school mechanics book, hoping to calculate this based on the laws of motion and Earth’s gravitational force.

Not so fast, alien science advisor! While the mechanics of a falling shuttle are relatively simple, the forces the shuttle would experience while penetrating the sand are much more complicated. Sand and other granular materials are composed of millions of individual solid particles that, together, may be stiff like a solid or flow like a fluid. This interstellar scientist first needed to know how sand particles interact with one another and how the uneven distribution of forces between them before dropping the cone-shaped probe.

In “Collisional model of energy dissipation in three-dimensional granular impact”, C. S. Bester and R. P. Behringer asked a similar question. In their study, they looked at the forces that a conical object (such as the alien commander’s spy shuttle) experienced as it penetrated a granular material and investigated how these forces affect the depth a conical object will burrow. 

Bester and Behringer dropped conical intruders into a container filled with sand with a thin rod attached to the top of the intruder for tracking.  They filmed each falling intruder from the side with a high speed camera, from which they determined the depth z, velocity, and acceleration as the intruder penetrated the sand. For a video of the experiment, see here. They used the seven intruders shown in Figure 1 . The intruders all had the same mass m but different shapes. The sharpness of the intruder’s cone-shaped tip was characterized by a parameter $latex s= \frac{2 L_{tip} }{w}$, the ratio of its length to half its width. A higher value of s corresponded to a sharper cone. They were dropped from a range of heights between 6 cm and 2 m, which resulted in intruders reaching different speeds upon impact with the sand.

An image of seven intruders used in the experiment, ranging from a blunt intruder to an intruder with a conical top.
Figure 1: intruders of equal mass used in the experiment, from the bluntest (s = 0) to the sharpest (s = 2.1). Image adapted from original article.

Bester and Behringer measured the stopping depth zstop and the time to stop tstop as a function of the initial kinetic energy each intruder had upon hitting the sand, $latex K_i = \frac{1} {2}m z_i$. They found that sharp intruders penetrated deeper into the sand than blunt intruders with the same kinetic energy Ki, as shown in Figure 2a. Figure 2b shows that, above an initial kinetic energy of 1 J, the time the intruders took to stop was the same regardless of shape or initial energy. 

Graphs of stopping depth as a function of kinetic energy and stopping time as a function of kinetic energy.
Figure 2: (a) Stopping depth as a function of kinetic energy. (b) Stopping time as a function of kinetic energy. Blue represents blunt intruders while red represents sharp intruders. Figure adapted from original article.

To understand what forces the intruder experiences as it comes to a stop, the authors focused on the inertial drag, or the drag caused by the pressure of the sand on the intruder.  Previous studies hypothesized that the inertial drag depended on the penetration depth and was proportional to the velocity squared of the intruder as it enters the granular material.  Bester and Behringer found that this was not the whole story. They calculated the inertial drag coefficient h(z) from the intruder trajectories, as shown in Figure 3a. Surprisingly, they found that the drag coefficient oscillated as the intruder penetrated the material. This suggested that the inertial drag was caused by collisions of the intruder with particles that are part of “force chains”. Force chains in a granular material are made up of connected particles that bear the majority of the forces in the material (see this earlier Softbites post for a detailed description). When the intruder hit a force chain, the drag increased due to the added resistance. The drag then decreased again when the chain was broken.

To investigate how the drag force was affected by the shape of the intruder, Bester and Behringer used the sum of the drag coefficient as the intruder penetrated the sand $latex \int {h(z) dz}$ [1]. Blunt intruders had a drag that increased nearly linearly with depth, while the dependence of drag on depth was much more curved for sharp intruders, as seen in Figure 3b. The authors suggested that the nonlinear drag for sharper cones was caused by the changing surface area interacting with the grains. Upon impact, a sharp cone only interacted with the sand through the tip. As it sunk, the area that was in contact with the sand increased nonlinearly, which resulted in larger drag.  

Plots of the drag coefficient vs. height, showing a bumpy curve, and the drag dependence on the depth of different intruders, showing that the drag experienced by  sharper intruders has a nonlinear relationship with depth.
Figure 3: (a) Drag coefficient h as a function of height z for an intruder shows fluctuations. (b) Drag dependence on depth for different intruders. The drag of blunt intruders has a roughly linear relationship with depth (blue curves) while that of sharp intruders has a nonlinear relationship with depth (yellow and red curves). Figure adapted from original article.

Bester and Behringer’s investigation into how the shape of a conical intruder falling into sand affects the forces it experiences is a beautiful example of how complex the interactions of everyday materials can be. According to their work, the aliens in our introduction should drop a pointy probe from very high up to make sure it gets buried — and also put some sensors on their probe to measure how its descent is interrupted by the force chains in the sand.  The aliens may have imaginary science fiction technology that allows them to traverse light years, but even they may marvel at the countless collisions that affect the path of something they drop on the beach once they reach the Earth.


[1] The sum of the drag coefficient  ($latex \int {h(z) dz}$) was calculated from the measured kinetic energy, and then the derivative of it was taken to obtain the drag coefficient h. Taking the derivative amplified the noise in the measurement.  Bester and Behringer compared the sum $latex \int {h(z) dz}$. for different intruders to avoid this amplified noise.

PARNET 2019: Granular and Particulate Networks

A granular material, such as sand, coffee beans, or balls in ball pit, is a collection of particles that interact with each other and dissipate energy. These materials can act like solids, flow like liquids, or suddenly transition between the two phases – for example, in a landslide, the soil stops holding its shape and flows. The Granular and Particulate Networks Workshop, PARNET19, brought together the physicists, engineers, and mathematicians who study these materials in a series of lectures and discussions.

Figure 1. Examples of granular materials: a. sand, b. coffee beans and c. a ball pit. 

PARNET19 took place at the Max Planck Institute in Dresden, Germany on July 8-10, 2019. I attended to represent Softbites at the science communication panel and to present my research on fly larvae as an active granular material.

The focus of the workshop was exploring the networks formed by the forces in granular materials. When granular materials are stretched or squeezed, they form networks of high forces known as force chains. These networks can be visualized with photoelastic disks, as described by this previous Softbites post.  In a series of 30 minute to 1 hour long scientific talks at PARNET19, the experimentalists who study granular materials and mathematicians who study topological networks discussed how network math can be applied to the force chains found in granular materials. Unusually, talks were followed by 30-minute discussion sessions in which the previous speakers answered questions and posed some of their own.

Modeling granular materials is difficult because they are made up of many individual particles. Simulating the interactions of all of the particles takes a very long time, even with a powerful computer: imagine trying to predict the motion of each sand grain on a beach! The other traditional way to model a granular material is with a continuum model — considering the material as a smooth (continuous) mass, instead of keeping track of individual particles. This works for materials like fluids or solids because the individual molecules that make them up are so small that their individual interactions don’t need to be understood. However, the relevant particles in a granular material are much bigger, relative to the size of the material as a whole, than molecules, which makes the interactions between the particles important. In a granular material, the critical interactions between the particles can result in sudden transitions such as landslides.

The approach taken by the PARNET workshop was to model the part of granular materials that will cause the entire material to change if it moves — the force chains through the grains. The goal of the workshop was to apply existing mathematical theories used to model networks, such as the connection of roads on a map, to understanding the connections of force chains in granular materials. For example, understanding when a force chain in the rocks making up a cliff is likely to fail can inform workers near the cliff about impending danger and allow them to evacuate before a landslide occurs.

Figure 2. Connecting granular materials experiments, such as the force chains pictured in (a), with pure network math, such as the Konigsberg bridge problem pictured in (b), was the main theme of the workshop. This problem gets challenging if we consider real, 3D materials

The scientific communication panel I was part of discussed a variety of topics, such as publishing journal articles in high or low impact factor journals, making scientific journals open access, and writing for a broad audience. A result of the discussion, we made the Softbites style guide publicly available – everyone wanted to read how we write and edit our posts! 

Group photo

For me, the main takeaway of the workshop was that the network view of granular materials is a promising one to predict catastrophic events. Understanding what causes a force chain to break can explain why some arrangements of granular materials are stable for a long time while others come crashing down with no obvious warning. However, connecting the complex and chaotic real-life granular materials in 3D to the purely theoretical math behind topological networks will prove challenging. Mathematical models of networks can be very abstract, and these theories need to be connected to physics in the real world. As with any theory, it is important to verify predictions with real-life experiments, but the force chains inside granular materials are difficult to measure.

Overall, this was one of the best conferences I’ve attended as a graduate student. The format of longer discussion sessions was very effective, as it allowed more time for elaborating on each speaker’s points than the traditional 5 minute long Q&A sessions. The PARNET workshop was a useful introduction to a new (to me) way of thinking about granular materials, one which I am implementing in my own research. If complex systems, such as granular materials, can be modeled by a simple set of topological equations, they will be much easier to understand and predict in future studies.

Flocking rods in a sea of beads: swarms through physical interactions

Original papers: Flocking at a distance in active granular matter


Many living creatures, such as birds, sheep, and fish, make coherent flocks or swarms. Flocking animals travel together, coordinating their speed and turns in an often visually striking manner. This can have benefits for the animals – flocking birds can use aerodynamics to fly more efficiently, sheep can move together as a group to evade predators, and fish can use collective sensing to find preferred locations in their environment. Flocks emerge in biological systems because animals try to follow their neighbors.

But how about non-living things? Can they spontaneously form swarms without any biological motive?

In “Flocking at a distance in active granular matter”, Nitin Kumar and colleagues investigate how non-living rods can form flocks just like animals do. They create a flock of self-propelled rods in a sea of spheres and show how a small concentration of these rods can transport a large load of passive spheres.

In this study, the active agents are cone-shaped brass rods, as in Figure 1a, that move through a layer of aluminum beads. The rods and beads are placed in a flower-shaped dish, as shown in Figure 1b, and covered by a glass lid. The surface vibrates, making the rods bounce up and down. Friction between the floor and ceiling propels a rod in the direction of its tip. Thus, each otherwise immobile rod moves by itself. Because the rod shape isn’t perfect, it turns a little with each movement, and randomly wanders around the surface.

4-1
Figure 1: (a) Schematic of a cone-shaped rod. (b) Experimental setup of brass rods moving through aluminum beads. The flower shape is used to prevent rod clumping at the walls. Figure adapted from the original article.


At low concentrations of both rods and beads, the rods wander around randomly and independently of one another. Past some critical concentration of either, however, the rods suddenly align and swarm around the surface in a random direction. Once the rods begin swarming clockwise or counterclockwise, they do not change which way they swarm.

A comparison of randomly moving and aligned rods is shown in Figures 2a and 2b. The motile rods drag the inactive beads alongside them. The flow of the beads then reorients rods throughout the surface, until the rods are aligned. This is similar to what happens in biological flocks, where each animal tries to follow their nearest neighbors. Small turns of individuals turn the entire flock, forming beautiful patterns.

The researchers created a “phase diagram” of rod and bead concentrations in the experiment (Figure 2c). At rod and bead concentrations below the black line, the rods move randomly. When either rod or bead concentration is increased, swirling begins. Increasing the number of rods increases the number of agents that can interact with each other. Increasing the number of beads increases the density of material through which the rod forces propagate. Finally, if the concentrations are too high, the system becomes jammed, and the rods can’t move enough to align in the first place.

4-2
Figure 2: (a) Randomly moving rods. (b) Aligned rods swirling in the same direction. (c) Phase diagram showing transitions between the different behaviors of the rods and beads depending on how concentrated they are. Image adapted from the original article.

So far we’ve just discussed the motion of the rods. But what about the beads themselves? The flocking rods push them in a coherent pattern, the velocity field of which is shown in Figure 3. The rods don’t just align – they also affect their surroundings, and transport the beads as cargo.

4-3
Figure 3: Velocity field of beads that are pushed around by swirling rods.

To figure out how rods align and swarm, Kumar and colleagues developed a mathematical model for the sea of beads and rods as a “fluid” of moving beads (since there are many more beads than rods) and simulated the motion of all the rods and beads. They identified two key parameters in their equations that corresponded to:

  • Adding more rods or stronger rods results in more beads being dragged, increasing the force on each rod.
  • The “weathercock effect” affects how easily rods turn to follow the flow of the beads surrounding them. A rod with an off-center pivot (as in Figure 4) that experiences a force from the surrounding beads will turn in the direction of the forcing.

The interplay of rods pushing beads, and beads reorienting rods, form a swarm.

4-4
Figure 4: “Weathercock effect” reorients rods with an off-center pivot in the direction of the flow of the surrounding beads.

This study shows that simple mechanical interactions can cause swarms. Living creatures, such as fish and bacteria, may have taken advantage of the swarms caused by their interactions with each other to survive as they evolved.

Seeing Inside Sand: Visualizing Force Chains with Photoelastic Disks

Original Article: Contact force measurements and stress-induced anisotropy in granular materials


As their name suggests, so-called “granular materials” are made up of “grains” — small (but macroscopic) pieces of sand, glass beads, coffee grounds, or almost any other solid you can think of. Granular materials can flow like a liquid (like sand in an hourglass), resist deformation like a solid (like the sand under your feet at the beach), or quickly transition between these states (like pebbles in a rockslide).

Granular materials have properties that have no equivalent in regular materials like wood, metal, or rubber. In solids like these — the kind we learn about in materials science class — a force applied to the surface propagates through the material smoothly and predictably. If a uniform force is applied to the surface of a material, every equally sized cross-section of that material bears the same amount of load. In granular materials, however, the situation is very different: in a sand pile under stress (that is, when a force is applied to its surface), the force is distributed unevenly — some individual sand grains bear far more load than others. Surprisingly, this remains true even when the sand grains themselves are identical. What’s more, the load-bearing grains connect to one another to make a fractal, lightning-like pattern inside the material, like that shown in Figure 1. These string-like arrangements of load-bearing grains are called force chains.

Screen Shot 2018-07-19 at 12.08.53 PM
Figure 1 – Force chains in a computer simulation of a sand pile. The thickness of a black line indicates the magnitude of the force at that point inside the sand pile. (From Nadukuru & Michalowski (2012).)

As Figure 1 shows, force chains are easy to identify in a computer simulation. But can you “see” forces inside a real material? Today’s paper — which is from 2005 but has already proven to be a classic in the field — shows us how it can be done. The secret lies in a clever choice of “grain”: in their experiments, Majmudar and Behringer use about 2,500 transparent plastic disks, each about a centimeter in diameter and half a centimeter tall. These disks are placed in a thin container that confines them to a single plane — this experiment is similar to the board game Connect Four, but without the vertical rails.

Crucially, these plastic disks have a property called photoelasticity: when they are stretched or squeezed, they deform, and when they deform they alter the polarization state of light passing through them. For instance, linearly polarized light might be converted into circularly polarized light, or light that’s still linearly polarized, but along a different axis than before. Thus, placed between crossed (perpendicularly oriented) polarizers, an unstressed disk will appear dark, but a squeezed or stretched disk will appear bright, since any alteration of the polarization state of the incoming light will allow some of it to pass through the second polarizer. What’s more, the pattern of light — like that shown in Figure 2 — can be used to infer the normal and tangential forces acting on each disk.

Screen Shot 2018-07-19 at 12.14.35 PM
Figure 2 – Two plastic disks placed between crossed polarizers [1]. For an unstressed disk (top), the polarization state of the light is unaltered, and no light gets through the second polarizer. For a disk under load (bottom), the polarization state of transmitted light is altered — in this case, the polarization axis is rotated — allowing some light to pass through the second polarizer. The forces on the disk, indicated by thick black arrows, can be inferred from images such as the one on the bottom right
By imaging lots of disks at the same time, photoelasticity can be used to infer the overall stress pattern inside a granular material. Majmudar and Behringer are especially interested in two particularly simple situations: isotropic compression and shear. Under isotropic compression, the collection of disks is squeezed equally from all sides, while under shear, the collection of disks is squeezed on top and bottom, but allowed to expand by an exactly equal amount at the sides.

Interestingly, the system responds very differently to these two types of load: for isotropic compression, the force pattern, shown in the left panel of Figure 3, resembles a random network — short chains of highly stressed disks connect over distances of a few diameters. For shear (Figure 3, right panel), the situation is very different: long force chains, tens of disk diameters in length, extend in the direction along which the system is being squeezed. This phenomenon, where an applied stress causes the material itself to change in a direction-dependent manner, is called stress-induced anisotropy; it is not captured by the linear elasticity theory that students typically learn, even in advanced material science classes.

In the decades since this paper was published, the techniques pioneered by Majmudar and Behringer have allowed scientists to better understand properties of granular materials: under what circumstances force chains form, how they depend on properties of the disk such as shape and friction coefficient, and how they influence behaviors such as jamming – the rapid transition from a flowing state to a rigid one.

Screen Shot 2018-07-19 at 12.18.06 PM
Figure 3 – A granular material under isotropic compression (left), and shear (right). In the sheared system, long, oriented force chains are clearly visible.


Postscript: On the day of publication, we learned of the recent death of the PI of this paper, Bob Behringer, at the age of 69. This post highlights just one of the many contributions of this widely respected scientist to the field of soft matter physics. For a more detailed overview of Behringer’s life and work, see here.


Notes:

[1] The experiment described in the paper used crossed (oppositely oriented) circular polarizers rather than the linear ones shown here, but the principle is the same.