Sticky light switches: Should I stay or should I go?

Original paper: Adhesion of Chlamydomonas microalgae to surfaces is switchable by light


One day it’s fine and next it’s…” red? Microscopic algae depend on photosynthesis, so they follow the light. Previous research has shown that their swimming is directed towards white light but not to red light. New work shows that light-activated stickiness allows microscopic algae to switch between different movement methods.

This indecision’s buggin’ me” – should I stick or should I swim? Different types of motility are needed to move through different environments. Microscopic algae live in a variety of different conditions, including soils, rocks, and sands, all surrounded by water. In general, we can split these conditions into two groups: those where the algae move within the water, or those where the algae move across a surface. Today’s paper studies how a unicellular algae changes from its free swimming state to a surface attached gliding state.

swimglide2008.png
Figure 1: Left: Chlamy’s normal swimming beat pattern, with different colors showing different time points. The cell body is shown in blue and the eyespot in red. Image adapted from [1]. Right: Gliding Chlamy moves due to proteins moving within the flagella. Image adapted from [2].
Kreis and co-workers investigate the unicellular green algae called Chlamydamonas reinhardtii, or Chlamy for short. It has two whip-like arms, called flagella, that it uses to move. In the swimming state, the flagella beat in a breaststroke to pull the cell forward, as shown in Figure 1A. In the gliding state, the flagella are stuck to a surface and the transport of proteins inside each flagellum pulls on the surface so the Chlammy moves across the surface, as shown in Figure 1B.

micropipetteFM2008
Figure 2: In micropipette force microscopy a small glass tube holds the cell. A surface (the substrate) can then be moved towards or away from the cell. The deflection of the micropipette as this occurs determines how sticky the cell is. All of this is done in water, where Chlamy lives normally. Image adapted from Kreis and coworkers’ paper.

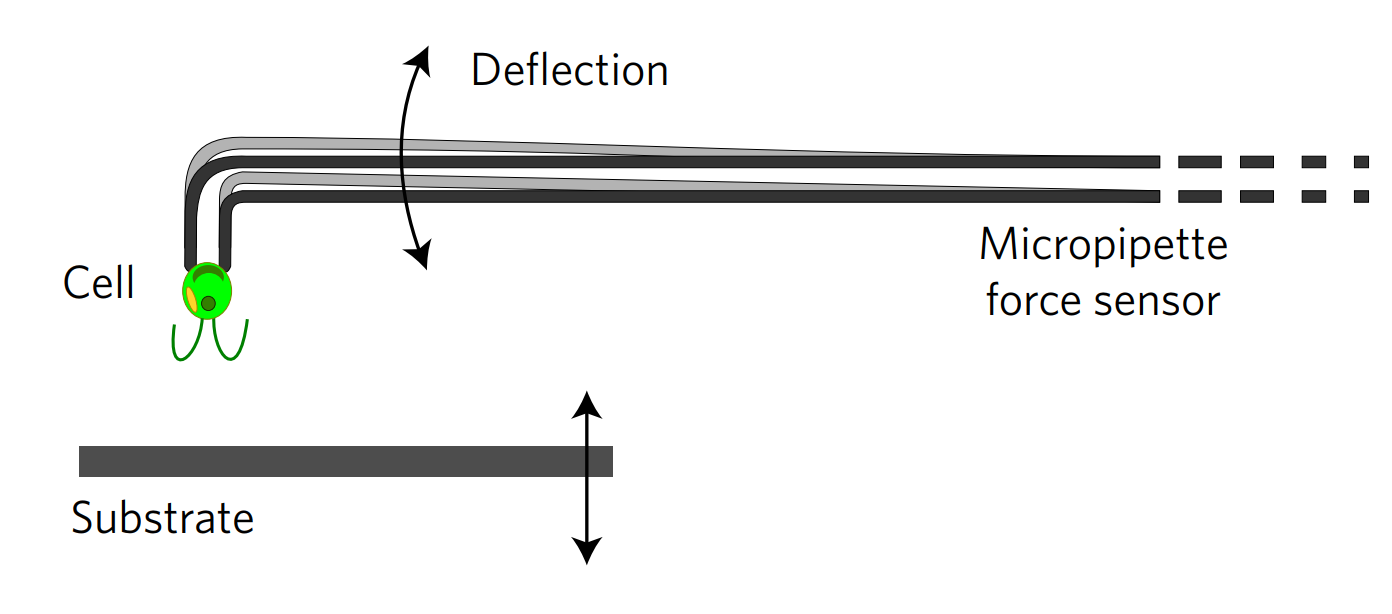
To transition between these two movement methods, the Chlamy must attach and detach from the surface. The researchers measure the force Chlamy exerts on a surface when it attaches using micropipette force microscopy, shown in Figure 2. This method uses a micropipette, which is a small glass tube, to hold a single Chlamy cell in place with suction. The surface is moved towards or away from the cell, deflecting the micropipette from its original position based on the force the cells exert on the surface. The relationship between deflection distance and force is measured beforehand with calibration experiments. So, during the experiment, micropipette deflection yields how strongly cells are stuck. To understand how this force relates to the two movements methods, let’s look at the results.

frontandback2008
Figure 3: Adhesion force as a function of distance from the surface to the cell. The surface is initially 20 micrometers away from the cell and is moved closer, so the cell and surface touch. As the surface is moved away again we can see if the flagella-facing cell (a) or the back-facing cell (b) attach to the surface from the adhesion force that is built up. Figure adapted from Kreis and coworkers’ paper.

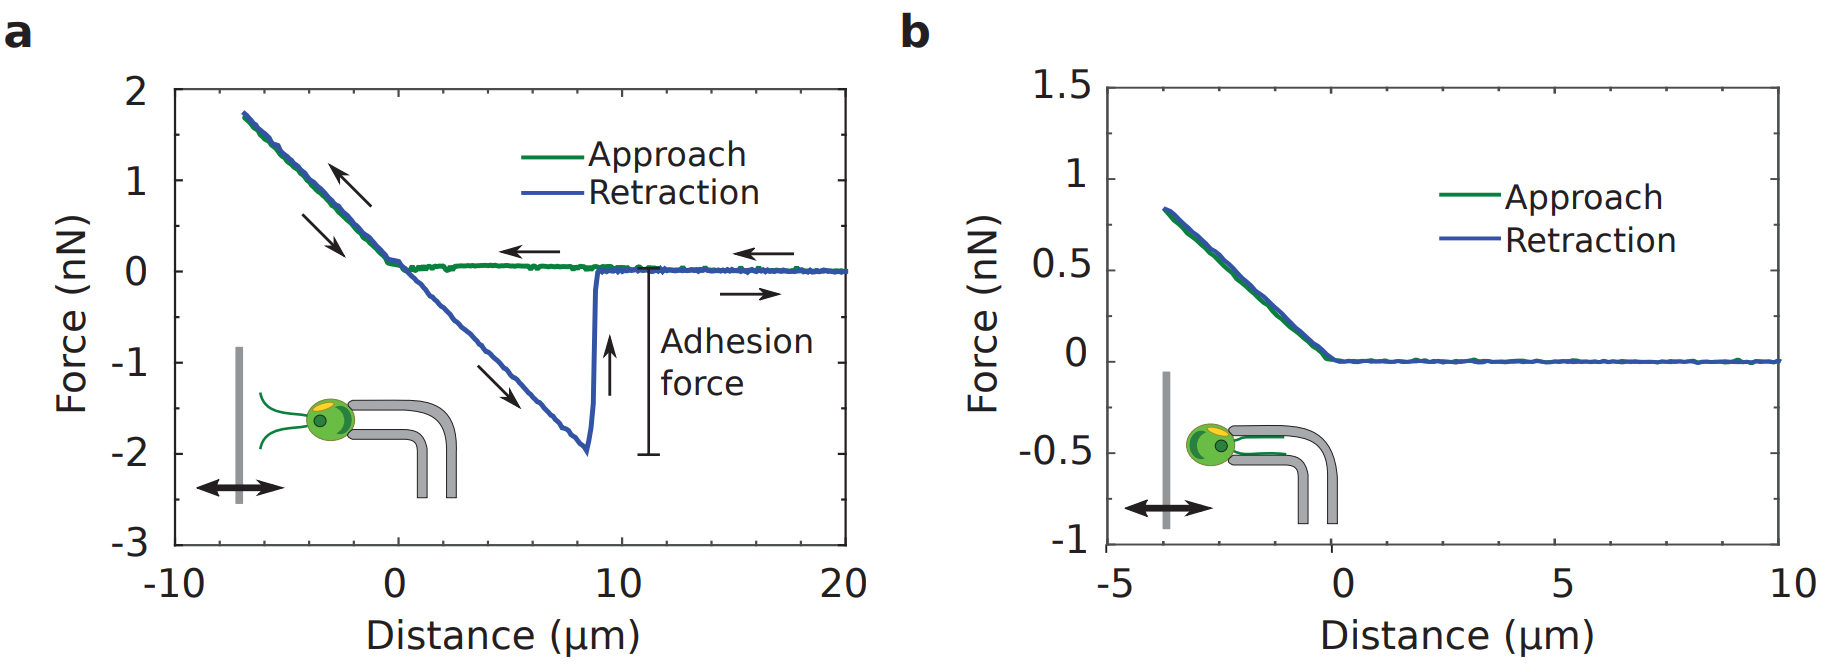
Figure 3 shows two force measurements, one where the flagella are facing the surface and another where the back of the cell is facing the surface. When the surface touches the flagella or back of the cell body, the micropipette is first deflected upwards, giving a positive force. As the surface is moved away, the micropipette moves back to its original zero-force position.

As the surface is moved further away, the flagella-facing cell and back-facing cell behave differently. The flagella-facing cell deflects the micropipette downwards, shown by the build-up of a largely negative force, whereas the back-facing cell does not deflect the micropipette and no force is exerted. This means that the flagella-facing cell sticks to the surface, whereas the back facing cell does not stick.

pullandgraph1009
Figure 4: Top row – left to right shows successive images of Chlamy pulling itself towards a surface – dashed red line shows the movement of the micropipette. The flagella are marked by solid red lines. Bottom row – micropipette deflection over time as the light is turned on and off as indicated by the arrows. Figure adapted from Kreis and coworkers’ paper.

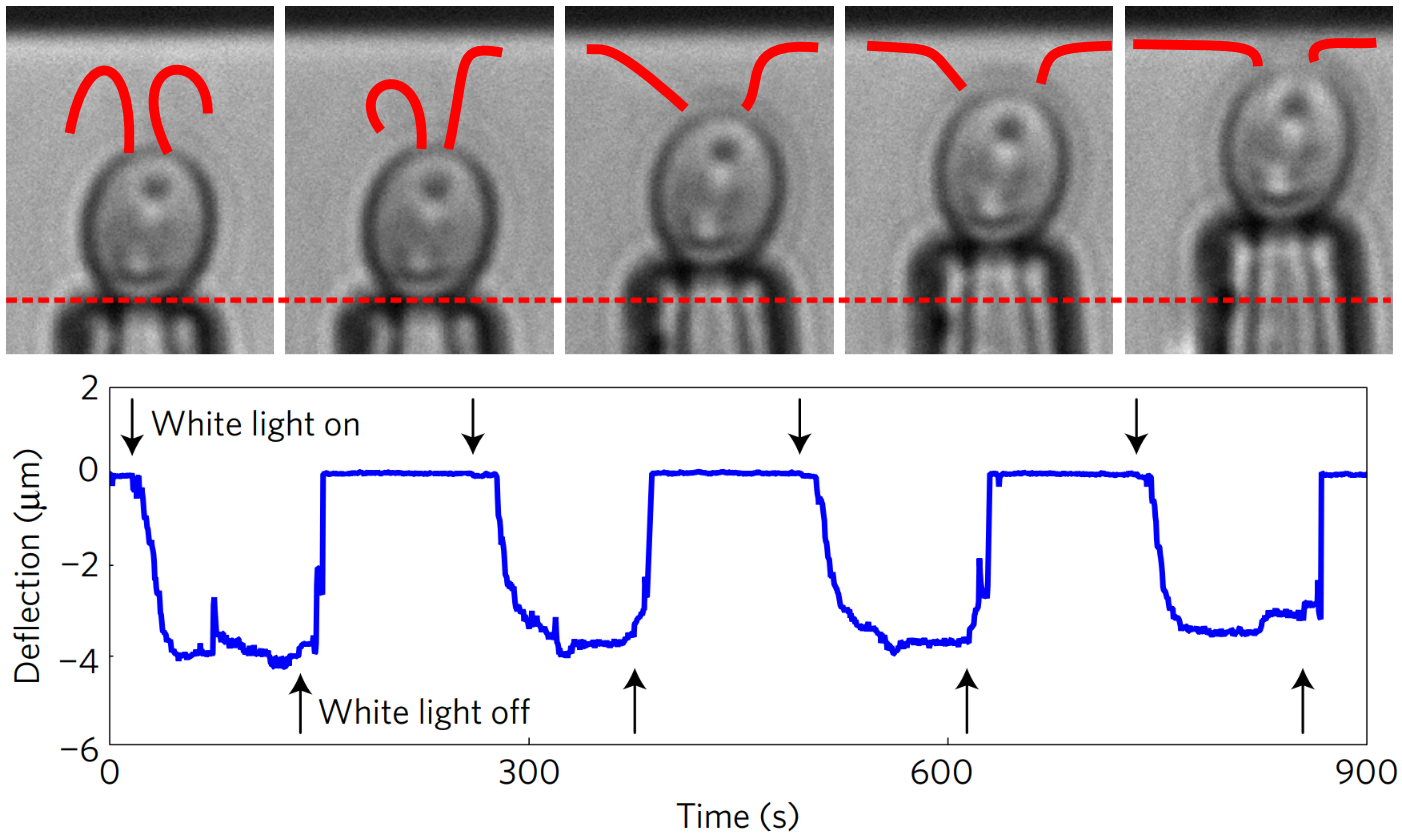
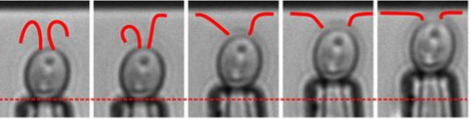
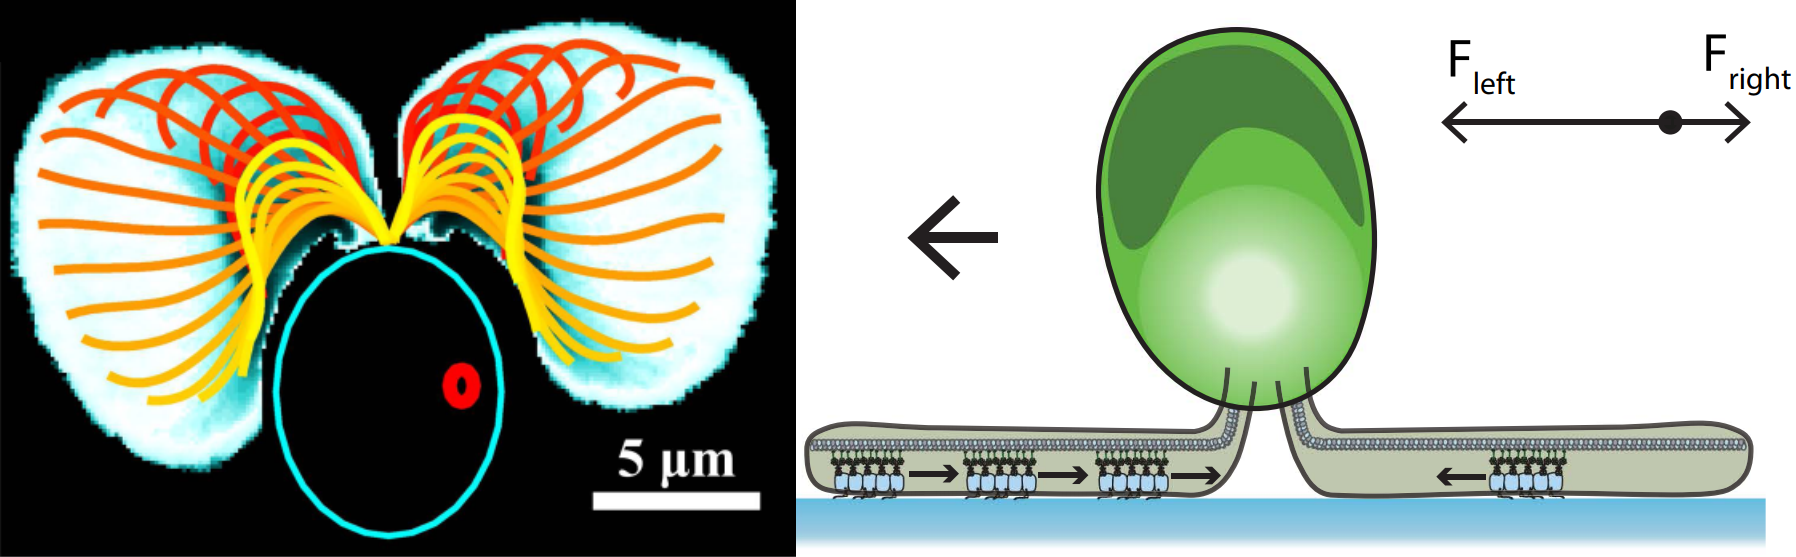
The flagella not only stick but actively pull themselves towards the surface. At the top of Figure 4, we see the flagella touch the surface during their swimming beat cycle. First, just a small part of one flagellum is stuck to the surface. Then, the flagella actively pull themselves towards the surface until both are completely stretched out and ready for gliding. This process is reversible: as the light is turned on and off, so is the adhesion force. The Chlamy can pull themselves up again and again – transitioning between their stuck and free state.

difflight2008
Figure 5: Force-distance curves for the retraction of a surface under different wavelengths of light. The flagella only stick when shorter wavelengths of light are present. Figure adapted from Kreis and coworkers’ paper.

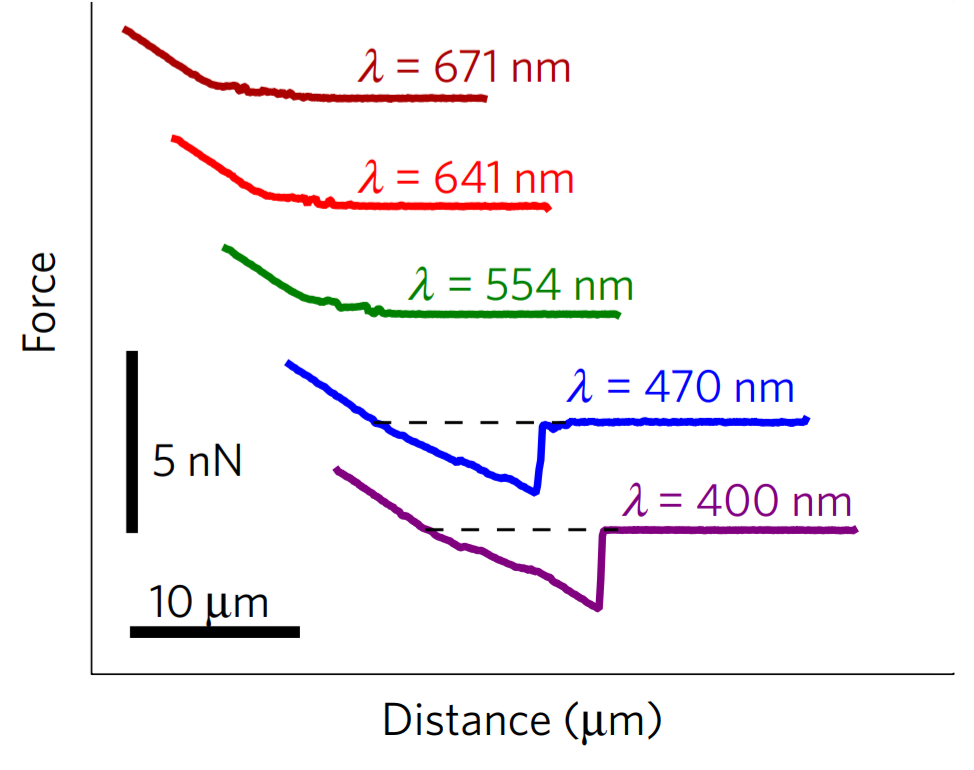
But what controls the transition? To answer this, the researchers repeated the experiment under different wavelengths of light. In Figure 5, we see that the stickiness peak is absent for red and green light but present for blue and purple light. Two potential light sensors could be responsible. One is on the cell’s eyespot and controls cell swimming to guide the cell towards the light. The other is on the flagella and controls the cell life cycle and several aspects of the cell’s mating process. But we don’t yet know which light sensor controls the stickiness, or which specific proteins make the flagella sticky.

So for the Chlamy, the decision to stay or go is made by checking if the lights are on! If they ‘go’ they can seek lighter environments, and if they ‘stay’ they can bask in the sunny spot. Watching Chlamy cells stick and un-stick as we flick a light switch is very cool, but why should we care about Chlamy? Chlamy is used in bioreactors to create biofuels and other bioproducts. Stuck Chlamy prevents light and nutrients from getting to all the cells in the reactor, so we need to understand how to control the sticking process. Plus – if we understand how a simple unicellular organism solves the problems of life, we can use this bio-inspiration for new technologies – in this case possibly new light-switchable adhesives.


[0] Should I Stay or Should I go?

[1] Antiphase Synchronization in a Flagellar-Dominance Mutant of Chlamydomonas

[2] Intraflagellar transport drives flagellar surface motility

Dividing Liquid Droplets as Protocells

Original paper: Growth and division of active droplets provides a model for protocells


In the beginning there was… what, exactly? Uncovering the origins of life is a notoriously difficult problem. When a researcher looks at a cell today, they see the highly-polished end product of millennia of evolution-driven engineering. While living cells are not made of any element that can’t be found somewhere else on earth, they don’t behave like any other matter that we know of. One major difference is that cells are constantly operating away from equilibrium. To understand equilibrium, consider a glass of ice water. When you put the glass in a warm room, the glass exchanges energy with the room until the ice melts and the entire glass of water warms to the temperature of the room around it. At this point, the water is said to have reached equilibrium with its environment. Despite mostly being made out of water, cells never equilibrate with their environment. Instead, they constantly consume energy to carry out the cyclic processes that keep them alive. As the saying goes, equilibrium is death[1]: the cessation of energy consumption can be thought of as a definition of death. The mystery of how non-equilibrium living matter spontaneously arose from all the equilibrated non-living stuff around it has perplexed scientists and philosophers for the better part of human history[2].

An important job for any early cell is to spatially separate its inner workings from its environment. This allows the specific reactions needed for life, such as replication, to happen reliably. Today, cells have a complicated cell membrane to separate themselves from their environment and regulate what comes in and what goes out. One theory proposes that, rather than waiting for that machinery to create itself, droplets within a “primordial soup” of chemicals found on the early Earth served as the first vessels for the formation of the building blocks of life. This idea was proposed independently by the Soviet biochemist Alexander Oparin in 1924 and the British scientist J.B.S. Haldane in 1929[3]. Oparin argued that droplets were a simple way for early cells to separate themselves from the surrounding environment, preempting the need for the membrane to form first.

In today’s paper, David Zwicker, Rabea Seyboldt, and their colleagues construct a relatively simple theoretical model for how droplets can behave in remarkably life-like ways. The authors consider a four-component fluid with components A, B, C, and C’, as shown in Figure 1. Fluids A and B comprise most of the system, but phase separate from each other such that a droplet composed of mostly fluid B exists in a bath of mostly fluid A. This kind of system, like oil droplets in water, is called an emulsion. Usually, an emulsion droplet lives a very boring life. It either grows until all of the droplet material is used up, or evaporates altogether. However, by introducing chemical reactions between these fluids, the authors are able to give the emulsion droplets in their model unique and exciting properties.


modelSchematic_fig1b
Fig. 1: Model schematic. A droplet composed mostly of fluid B (green) within a bath of fluid A (blue). Inside the droplet, B degrades into A. Outside the droplet, fluids C and A react to form fluids B and C’. Adapted from Zwicker and colleagues.


The chemical reactions in the model are fairly simple (see figure 1). Fluid B spontaneously degrades into fluid A and diffuses out of the droplet. While fluid A cannot easily turn back into fluid B (since spontaneous degradation implies going from a high energy state to a low one), fluid C can react with A to create fluids B and C’, and this fluid B can diffuse back into the B droplet.

$latex B \to A \quad \text{and} \quad A+C \to B+C’$

If C and C’ are constantly resupplied and removed, respectively, they can be kept at fixed concentrations. Without C and C’, the entire droplet would disappear by degrading into fluid A, reaching equilibrium. Here, C and C’ act as fuel that constantly drives the system away from equilibrium, creating what the authors dub an “active” emulsion. Active matter systems like this one have had success in describing living things because they, like all living matter, fulfill the requirement of being out-of-equilibrium.

Because the equations that describe how fluids A and B flow over time are so complicated, the authors solve their model using a computer simulation. When they do, something remarkable happens. Emulsions with no chemical reactions with their surrounding fluids never stop growing as long as there is more of the same material nearby to gobble up. This process is called Ostwald ripening[4]. The authors find that an active emulsion system, due to the fact that material is constantly turning over, suppresses Ostwald ripening and allows the emulsion droplet to maintain a steady size.

In addition to limited growth, the authors also find that the droplets undergo a shape instability that leads to spontaneous droplet division (see this movie). This occurs due to the constant fuel supply of C and C’. The chemical reaction A+C ? B+C’ creates a gradient in the concentration of fluids A and B outside the droplet. Just outside the droplet, there is a depletion of B and an abundance of A, while far away from the droplet, A and B reach an equilibrium concentration governed by the rate of their reactions with C and C’. The authors dub this excess concentration of B far away from the droplet the supersaturation. Where there exists a gradient in the concentration of a material, there exists a flow of that material, called a flux. This is the reason a puff of perfume in one corner of a room will eventually be evenly distributed around that room. The size of the droplet is dependent on the flux of fluid B into and out of the droplet.

Two quantities determine the evolution of the droplet. The first is the supersaturation that reaches a steady value once all fluxes stop changing in time, and the second is the rate at which the turnover reaction B?A occurs. For a given supersaturation and turnover rate, the authors can calculate how large the droplet will grow, and they find three distinct regimes. In one regime, the droplet dissolves and disappears as the turnover rate outpaces the flow of fluid B back into the droplet. Another has the droplet grow to a limited size and remain stable, since the turnover and supersaturation balance each other out and give a steady quantity of fluid B. The third and most interesting regime occurs if the droplet grows beyond a certain radius due to the influx of fluid B outpacing its efflux. Here, a spherical shape is unstable and any small perturbation will result in the elongation and eventual division of the droplet (Figure 2).


dropletStabilityDiagram_fig2b
Fig. 2: Stability diagram of droplets for normalized turnover rate $latex \nu_-/\nu_0$ vs supersaturation $latex \epsilon$. For a given value of $latex \epsilon$, the diagram shows regions where droplets dissolve and eventually disappear (white), grow to a steady size and remain stable (blue), and grow to a steady size and begin to divide (red). Adapted from Zwicker and colleagues.


And that’s it. If you have two materials that phase separate from each other, coupled to a constant fuel source to convert one into the other, controlled growth and division will naturally follow. While these droplets are more sophisticated than regular emulsion droplets, they are still a far cry from even the simplest microorganisms we see today. There is no genetic information being replicated and propagated, nor is there any internal structure to the droplets. Further, the droplets lack the membranes that modern cells use to distinguish themselves from their environments. An open question is whether a synthetic system exists that can test the model proposed by the authors. Nevertheless, these active emulsions provide a mechanism for how life’s complicated processes may have gotten started without modern cells’ complicated infrastructure.

Though many questions still remain, Zwicker and his colleagues have lent considerable credence to an important, simple, and feasible theory about the emergence of life: it all started with a single drop.


[1]: This isn’t exactly true. Some organisms undergo a process called anhydrobiosis, where they purposefully dehydrate and rehydrate themselves to stop and start their own metabolism. Also, some bacteria slow their metabolism to avoid accidentally ingesting antibiotics in a process called “bet-hedging”.

[2]: For example, ancient Greek natural philosophers such as Democritus and Aristotle believed in the theory of spontaneous generation, eventually disproven by Louis Pasteur in the 19th century.

[3]: Oparin, A. I. The Origin of Life. Moscow: Moscow Worker publisher, 1924 (in Russian), Haldane, J. B. S. The origin of life. Rationalist Annual 148, 3–10 (1929).

[4]: Ostwald ripening is a phenomenon observed in emulsions (such as oil droplets in water) and even crystals (such as ice) that describes how the inhomogeneities in the system change over time. In the case of emulsions, it describes how smaller droplets will dissolve in favor of growing larger droplets.

Knotty DNA

Original paper: Direct observation of DNA knots using a solid-state nanopore


Try taking out your earphones from your pocket and, in all probability, you’ll find knots and entanglements between the ends. As it turns out, this knotting effect is not limited to macroscopic objects, but occurs on the nanoscale as well. A DNA molecule that carries the genetic information of a living organism is actually a long string-like polymer, so you can imagine that it would also get tangled up just like the cords of your earphones. In fact, scientists know that DNA does form knots when it is in the nucleus of a cell, and these knots need to be removed by specialized bio-molecules, called enzymes, so that a cell can ‘read’ the genetic information encoded in the DNA. [1] In today’s paper, Calin Plesa and his colleagues at TU Delft are able to observe and measure these knots in DNA strands. In the process, they also observe interesting knotting behaviour which has not been observed before.

Knots on DNA

DNA translocation through a solid-state nanopore
Figure 1: This animation shows the DNA moving  through the nanopore. The associated dip in current is mapped onto the graph below. (Animation created by Calin Plesa, available under CC BY-SA license)

The researchers use a nanopore sensor to infer the structural properties of a DNA molecule. The sensor is made up of two reservoirs filled with electrolyte (a solution which separates into cations and anions, which can be used to conduct electricity, e.g. a salt solution), and they are separated by a membrane, or thin sheet, with a tiny hole in it. An electric field applied across the membrane generates an ionic current in the electrolyte and also pulls a negatively charged DNA strand through the tiny opening. The passage of a DNA strand through the nanopore causes a dip in the ionic current that is proportional to the volume of ions displaced—in other words, it’s proportional to the size of the molecule (a typical scenario is shown in Figure 1). Therefore, a knot in the DNA can generate a bigger drop in the current than an untangled strand. From this difference it is possible to infer the characteristics of the knot itself, since a bigger drop indicates a bigger knot.

The typical time for a DNA to pass through the pore is in the order of a few milliseconds, when the DNA is in a solution of potassium chloride (which is the typical salt solution used to carry out nanopore experiments). This makes it difficult technically, to see any features present on the DNA. Previous work has shown that it is possible to slow down the DNA passage by at least 10 times by using lithium chloride as their salt solution. [3] This increase in the translocation time (time it takes for the DNA to pass through the pore) is necessary to clearly see the additional dip in the current as the knot traverses the pore, as illustrated in Figure 2.

Translocation of a DNA molecule containing a trefoil knot through a solid-state nanopore
Figure 2: This animation shows a DNA with a knot moving through the pore. An additional dip in the current can be seen in the current trace as the knot (purple line) passes through the pore. (Animation created by Calin Plesa, available under CC BY-SA license)

The dip in the current signal caused by the knot passing through the pore can then be used to infer characteristics about the knot. In particular, it can be used to calculate the size of the knot, which has not been experimentally determined before. This has both physical and biological significance. Physically, it helps us understand the types of knots being formed on polymers as it can tell us whether the knot is loose or tightly formed. Biologically, it can help us understand how naturally occurring enzymes are able to disentangle knots in DNA strands, a function which is still poorly understood. The size of the knot is estimated by using

$latex d= v t$

where d is the length of the knot along the DNA strand, v is the average speed of the DNA translocation, and t is the time the knot takes to traverse the pore. Using this technique, the researchers estimate that the majority of the knots are less than 100 nm long. Previous research has shown that the DNA strand is rigid over lengths shorter than 50 nm, so considering this, the estimated knot size suggests that the knot is very tight. [2] However, this result needs further analysis, as the process of pulling the DNA through the nanopore might cause the knot to tighten, so this might not be the knot’s size in its natural state.

Slipping and sliding knots

When considering a linear (think: a thread with loose ends) DNA molecule, there is a possibility of the knot ‘slipping’ off the end of the strand before it gets pulled into the nanopore. For the knot to traverse the pore, it needs to be pulled fast enough to get squeezed to the size of the pore. If this process doesn’t happen fast enough the knot ‘halts’ at the pore entrance while the unknotted region translocates through. This allows the knot to disentangle, in case of a linear DNA molecule.

To determine if this slipping process occurs in knotted DNA strands, the researchers repeat their experiment using a circular (think: a thread joined end-to-end) DNA molecule. By using a closed loop they avoid possibility of the knot disentangling, but the knot can still slip towards the trailing end of the DNA during the translocation. The position of the knot is determined by the position of the dip in the current signal (purple line in Figure 2). They measure the probability of finding the knot at each position along the strand using two voltages, 100 mV and 200 mV. As shown in Figure 3, the knots show a preference for sliding toward the trailing end of the molecule at higher voltages, indicating that pulling too hard on the leading end of the DNA strand can indeed cause knots to slip along the strand instead of being pulled through the pore. The researchers also observe a 55% higher knotting occurrence in the circular molecules compared to linear ones. This suggests that knots may have slipped off the end of the linear molecules, thereby not detecting them at all.

Figure 4
Figure 3: The graph shows the probability of detecting the position of the knots along the length of DNA. At 200mV, the knots are observed to be at the trailing end of the DNA motion indicating the slipping phenomenon (adapted from Plesa et al.)

The researchers in this study have shown that naturally induced knots occur in DNA strands and they measured the sizes of those knots, which were previously unknown. This measurement showed that the knots detected are actually quite tight, which was not expected, although this result still needs to be investigated further. Additionally, these knots were seen to slide along the DNA molecules as they traversed the nanopore due to the strong pull at the end of the DNA strand. This was seen clearly by repeating the knotting experiments using circular DNA where there were no ends for the knots to slide off.

This new information about the structure of knots in DNA strands will help inform future studies of the complex topological structures formed in biomolecules such as DNA and proteins. It will also contribute to understanding the effects of topological features on the biological functions of these long, string-like biomolecules. In effect, it can help us explain the consequence of knotted DNA on the cell’s function as well as how the cell is equipped to handle these defects.

[1] http://www.tiem.utk.edu/~gross/bioed/webmodules/DNAknot.html

[2] Baumann, Christoph G., et al. “Ionic effects on the elasticity of single DNA molecules.” Proceedings of the National Academy of Sciences 94.12 (1997): 6185-6190.

[3] Kowalczyk, Stefan W., et al. “Slowing down DNA translocation through a nanopore in lithium chloride.” Nano letters 12.2 (2012): 1038-1044.

Termite Climate Control

Original Article: Termite mounds harness diurnal temperature oscillations for ventilation (Non-paywall version here.)


Disclosure: The first author of this paper, Hunter King, is a friend of the present writer (CPK).

Termites are among nature’s most spectacular builders, constructing mounds that can reach heights of several meters. Relative to the size of their bodies, these structures are considerably larger than the tallest skyscrapers constructed by humans [1]. Surprisingly, in many termite species, individual termites don’t spend much time in these mounds. Instead, they live in an underground network of tunnels and chambers that can be home to millions of individual insects. But, if not to live in them, why do termites build such intricate and gigantic above-ground structures [2]?

Scientists have suggested several possibilities: mounds might provide protection from predators, or guard against rain or dramatic changes in temperature. Recent research, however, has focused on the idea that a mound’s main purpose could be to provide ventilation. The problem of ventilation is particularly important for species such as Odontotermes obesus, native to the Indian subcontinent, that “farm” a species of fungus [3]. As human cultivators will no doubt be aware, indoor farming requires careful control of atmospheric conditions. According to this picture, the mound functions like a giant lung, enabling the colony to expel carbon dioxide and exchange it for atmospheric oxygen. But how exactly might this lung work?

Human lungs use a muscle, the diaphragm, to mechanically push out old (carbon-dioxide-rich) air, and suck in fresh (oxygen-rich) air. Obviously, termite mounds don’t have moving parts that would allow them to do this. So what is the physical mechanism that drives gas to flow around the ventilation shafts inside the mound? Over the years, researchers have proposed several ideas, including driving by thermal buoyancy (the tendency of hot air to rise upwards) or external wind. The details of these models are controversial: for instance, thermal-buoyancy-driven flows require temperature differences between different parts of the mound. Are these temperature gradients caused by external heating (that is, from the sun), or by heat generated by the bodies of the termites themselves [4]?

In today’s paper, Hunter King, Samuel Ocko and Lakshminarayanan Mahadevan describe a series of experiments that might help to answer some of these questions. To test the “mound-as-lung” model described above, King and co-workers designed and built directional airflow sensors tailored to the cramped environment and low airspeeds found in the ventilation shafts of mounds built by O. obesus. The mounds, shown in Fig 1A, look a bit like a half-folded umbrella, with ripple-like “flutes” decorating a roughly cone-shaped structure.


Untitled.001.jpeg
Figure 1 (A) An O. Obesus termite mound, with a bike shown in the background for scale. (B) Thermal images of the same mound, taken with an IR camera. The left half-image was taken at night, and shows that the interior of the mound is hotter (more yellow) than the flutes. In the half-image on the right, taken during the day, the hot regions are on the outside. Images courtesy of H. King, S. Ocko and N. Ocko.


King and co-workers measure, as a function of time of day, the air flow velocity in the ventilation conduits near the base of the flutes. These measurements, as the authors put it, are “difficult for several reasons,” in particular the “hostile and dynamic” environment inside the mound — the tendency of termites to aggressively attack anything placed inside their nest, and cover it with “sticky construction material.” As well as measuring the air velocity, King and co-workers use temperature sensors to measure the temperature profile of the surface of the mound, and the carbon dioxide concentration in the nest, underneath the mound, and at the “chimney,” near the top of it. To test the role of heat generated by the bodies of the termites, the researchers also study a “dead” — that is, abandoned — mound.


termite_graph.png
Figure 2: The top two panels show the air velocity and temperature differential for living mounds (top panel) and one dead mound (middle panel). The bottom panel shows the carbon dioxide concentration in the underground nest, and in the chimney, near the top of the mound. Carbon dioxide in the nest builds up when the temperature differential is small and the air flows slowly. It starts to decrease with increasing temperature differential and increasing flow speed (i.e. more negative flow velocity).


The results of some of these experiments are shown above. In particular, King and co-workers observe similar flow and temperature patterns in the “living” and “dead” mounds and conclude that metabolic heating is not the central mechanism driving ventilation. Noting that the direction of the flow reverses during the night, King concludes that “diurnally driven temperature gradients” — that is, temperature differences caused by the day/night cycle — ventilate the nest. This process is facilitated by the most distinctive architectural feature of the mound, the flutes.

Like fins on a radiator, the flutes efficiently exchange heat with their environment. In the heat of the sun, the flutes heat up faster than the interior, as shown in the IR camera image above. This causes the air in the flutes to rise, thus creating circulation inside the mound. The resulting flow carries oxygen-rich air from the chimney down to the nest. During the night, the flutes cool down faster than the interior, causing the flow pattern to reverse. According to the model that King and his colleagues propose, the termite mound performs the unusual feat of extracting useful work from oscillations in an intensive (in the sense of thermodynamics) environmental parameter.

King and his co-workers speculate that this energy-efficient ventilation strategy, which has evolved over millions of years, might provide inspiration for human designers of environmentally friendly architecture.

Note: After this post was written (but before it was published), the same team published a second paper where they try to find out if the same model applies to mound built by another species of termite that lives on a different continent (spoiler: it does, but some of the details differ).

=======================================================

Notes:

[1]

latex-image-1.jpg

latex-image-2.jpg

[2] http://www.bbc.com/earth/story/20151210-why-termites-build-such-enormous-skyscrapers

[3] The termites bring partially digested wood back to their nest, where the fungus extracts nutrients and energy from it. In return, the fungus produces fruiting bodies that the termites can eat. The relationship between termite and fungus can be referred to as “farming” or “symbiosis,” depending on your point of view.

[4] The latter mechanism is how honey-bees maintain a constant hive temperature. This ability to preserve “hive homeostasis” is one of the reasons that honeybees can survive in wildly varying climates.