I'm a third year grad student in the applied physics PhD program at Harvard. I study structural color made from disordered assemblies of colloidal particles. When I'm not doing research, I like to spend time rock climbing, listening to music and podcasts, and reading novels.
Look inside a glass of milk. Still, smooth, and white. Now put a drop of that milk under a microscope. See? It’s not so smooth anymore. Fat globules and proteins dance around in random paths surrounded by water. Their dance—a type of movement called Brownian motion—is caused by collisions with water molecules that move around due to the thermal energy. This mixture of dancing particles in water is called a colloid.
Colloids are one of the classic topics in soft matter, a field of physics that covers a broad range of systems including polymers, emulsions, droplets, biomaterials, liquid crystals, gels, foams, and granular materials. And while I can keep adding items to this list, I can’t give you a precise definition for soft matter. I’ve never seen a completely satisfying definition, and I’m not going to even attempt to provide that here. But I can give you a taste of some of the definitions, and I hope you’ll come away with the feeling that you sort of know what soft matter is.
The phrase “soft matter” brings to mind pillows and marshmallows. These things fall under physicist Tom Lubensky’s definition (given in a 1997 paper) of soft materials as “materials that will not hurt your hand if you hit them.” And while many materials in soft matter are too squishy to hurt you, some of them might—cross-linked polymers can be pretty hard. And what about colloids? Slapping milk won’t hurt, but it also seems strange to call milk soft.
To understand what the “soft” refers to in “soft matter”, we first have to know where the name came from. The French term “matière molle” was coined in Orsay around 1970 by physicist Madeleine Veyssié, who worked in the research group of one of the founding fathers of soft matter, Pierre-Gilles de Gennes. The phrase apparently started as a private joke within the de Gennes group (don’t ask me what it meant), and the English translation of “soft matter” was popularized by de Gennes in a lecture he gave after winning the Nobel prize in 1991. De Gennes wrote that soft matter systems have “large response functions”, meaning that they undergo a large (don’t ask me how large) change in response to some outside force. So it seems we’re meant to take “soft” to mean something closer to “sensitive”, not necessarily soft in a tactile sense.
Now we can think about why colloids are soft from a different perspective. Remember that milk droplet under the microscope? The fats and proteins move around in the droplet due to thermal energy in the water; they are “sensitive” to the forces caused by thermal energy.
But even this “large response functions” idea doesn’t describe everything in soft matter. Some topics often considered a part of the field are concerned with general mathematical concepts instead of particular materials or systems. Take, for example, particle packing—the way particles arrange themselves to fit into confined spaces. Studying how particles can be arranged to pack on a curved surface is a mathematical problem and isn’t directly related to large response functions. However, since classic soft matter systems such as colloids are made up of particles you might want to pack, it makes sense to include packing as part of the field.
For every definition you give for soft matter, you can find a system that doesn’t quite fit. In an APS news article from 2015, Jesse Silverberg described soft matter as “…an amalgamation of methods and concepts” from “physics, chemistry, engineering, biology, materials, and mathematics departments. The problems that soft matter…examines are the interdisciplinary offspring that emerge from these otherwise distinct fields.” So maybe it’s not that important to have a rigid definition for soft matter; maybe its indefinability should be part of its definition. Soft matter is a field where the lines between traditional scientific disciplines are becoming ever more blurred—or, rather, soft.
Figure 1. A 2-cm dried drop of coffee with a stain around the perimeter, forming a coffee ring. Adapted from Deegan et. al.
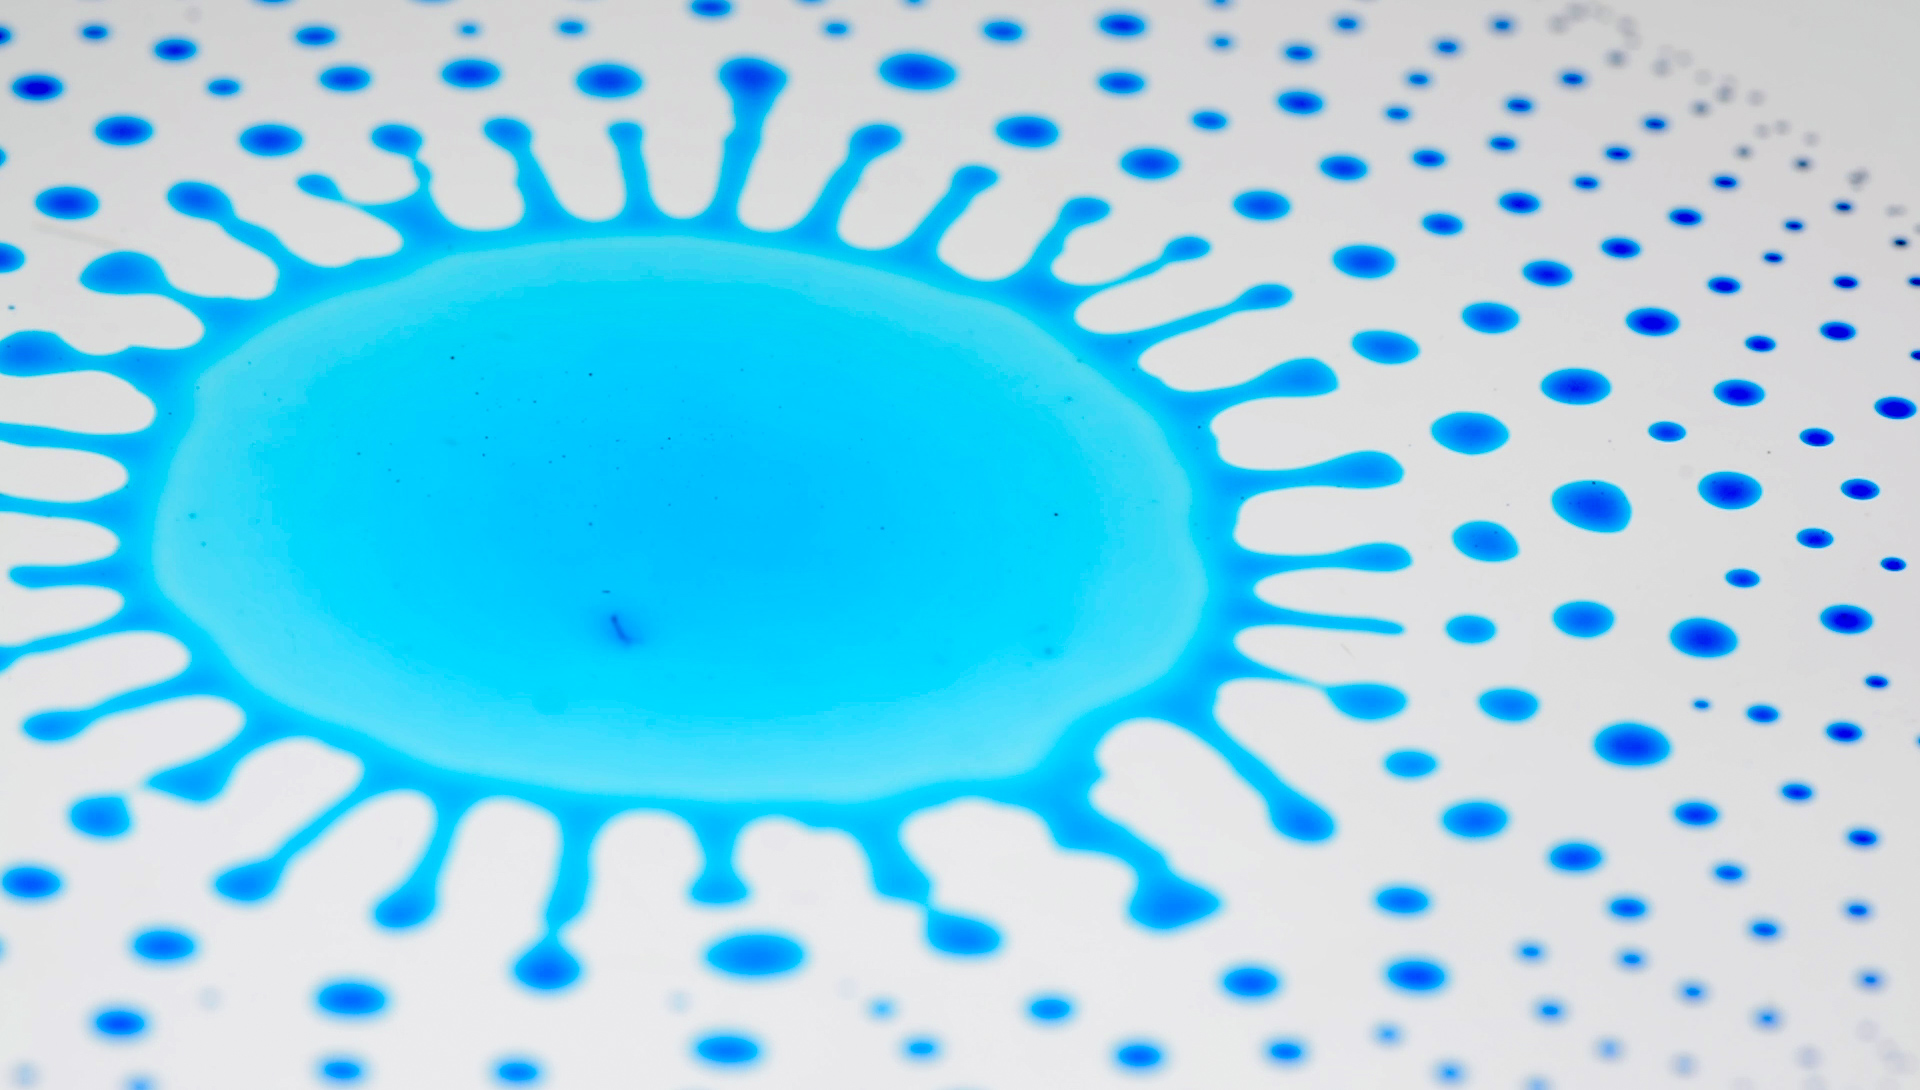
I’ve spilled a lot of coffee over the years. Usually not a whole cup, just a drop or two while pouring. And when it’s just a drop, it’s easy to justify waiting to clean it up. When the drop dries on the table, it forms a stain with a ring around the edges (Figure 1), giving it the look of a deliberately outlined splotch of brown in a contemporary art piece (when I say “coffee ring” I mean the small-scale, spontaneously formed stain around the edge of the original drop, rather than the imprint left on a table from the bottom of a wet coffee cup). But the appearance of these stains is simply a result of the physics happening inside the drop. Coffee is made of tiny granules of ground up coffee beans suspended in water, so the ring must mean that these granules migrate to the edge of the droplet when it dries. Why do the granules travel as they dry? Today’s paper by Robert D. Deegan, Olgica Bakajin, Todd F. Dupont, Greb Huber, Sidney R. Nagel, and Thomas A. Witten provides evidence that coffee rings arise due to capillary flow–the flow of liquid due to intermolecular forces within the liquid and between the liquid and its surrounding surfaces.
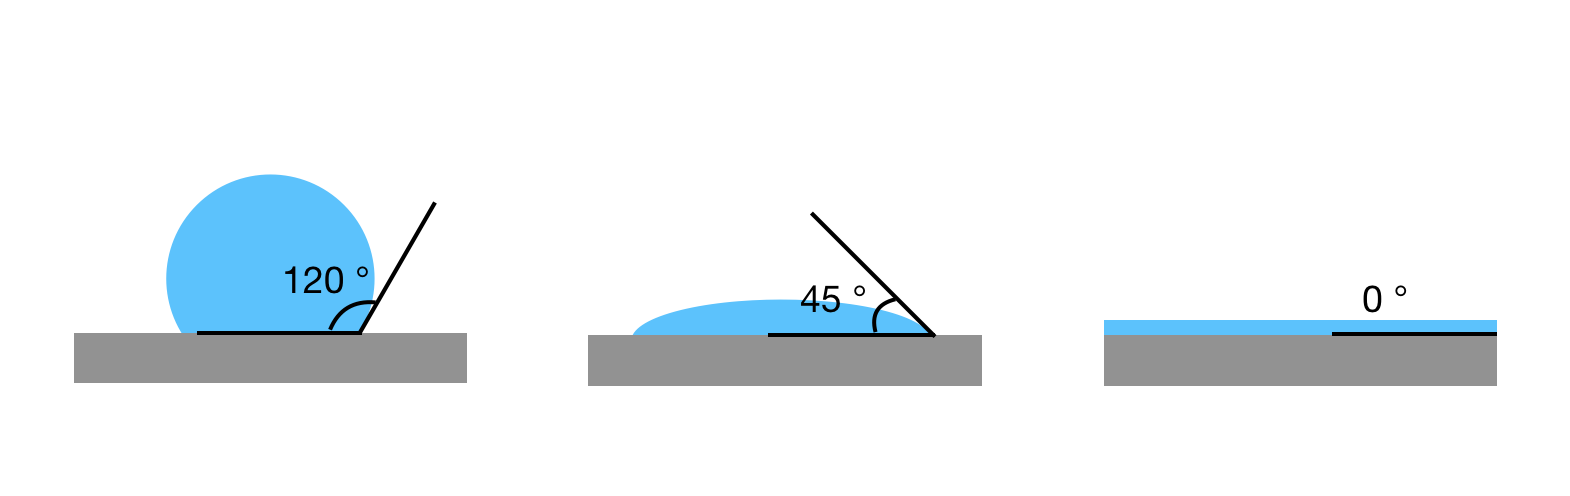
Figure 2. Diagrams of contact angles for different droplets. From left to right, the first is exhibits poor wetting, with a large contact angle. The next has good wetting, with a smaller contact angle. The last has perfect wetting, with a contact angle of zero, and coffee grains suspended in this solvent would not be able to form a ring upon drying.
The researchers found that these rings don’t just form in coffee. Their observations showed that the rings form in a wide variety of solutes (the suspended coffee granules), solvents (the water), and substrates (the table you spill on) as long as a few conditions are met. First of all, the droplet has to have a non-zero contact angle[1] (See Figure 2). In other words, the droplet doesn’t spread out into a completely flat puddle on the table. Second, the contact line has to be pinned. This means that the surface has irregularities or roughness that cause the edge of the droplet to get stuck in place. Last, the solvent has to evaporate; the ring won’t form if the droplet never dries.
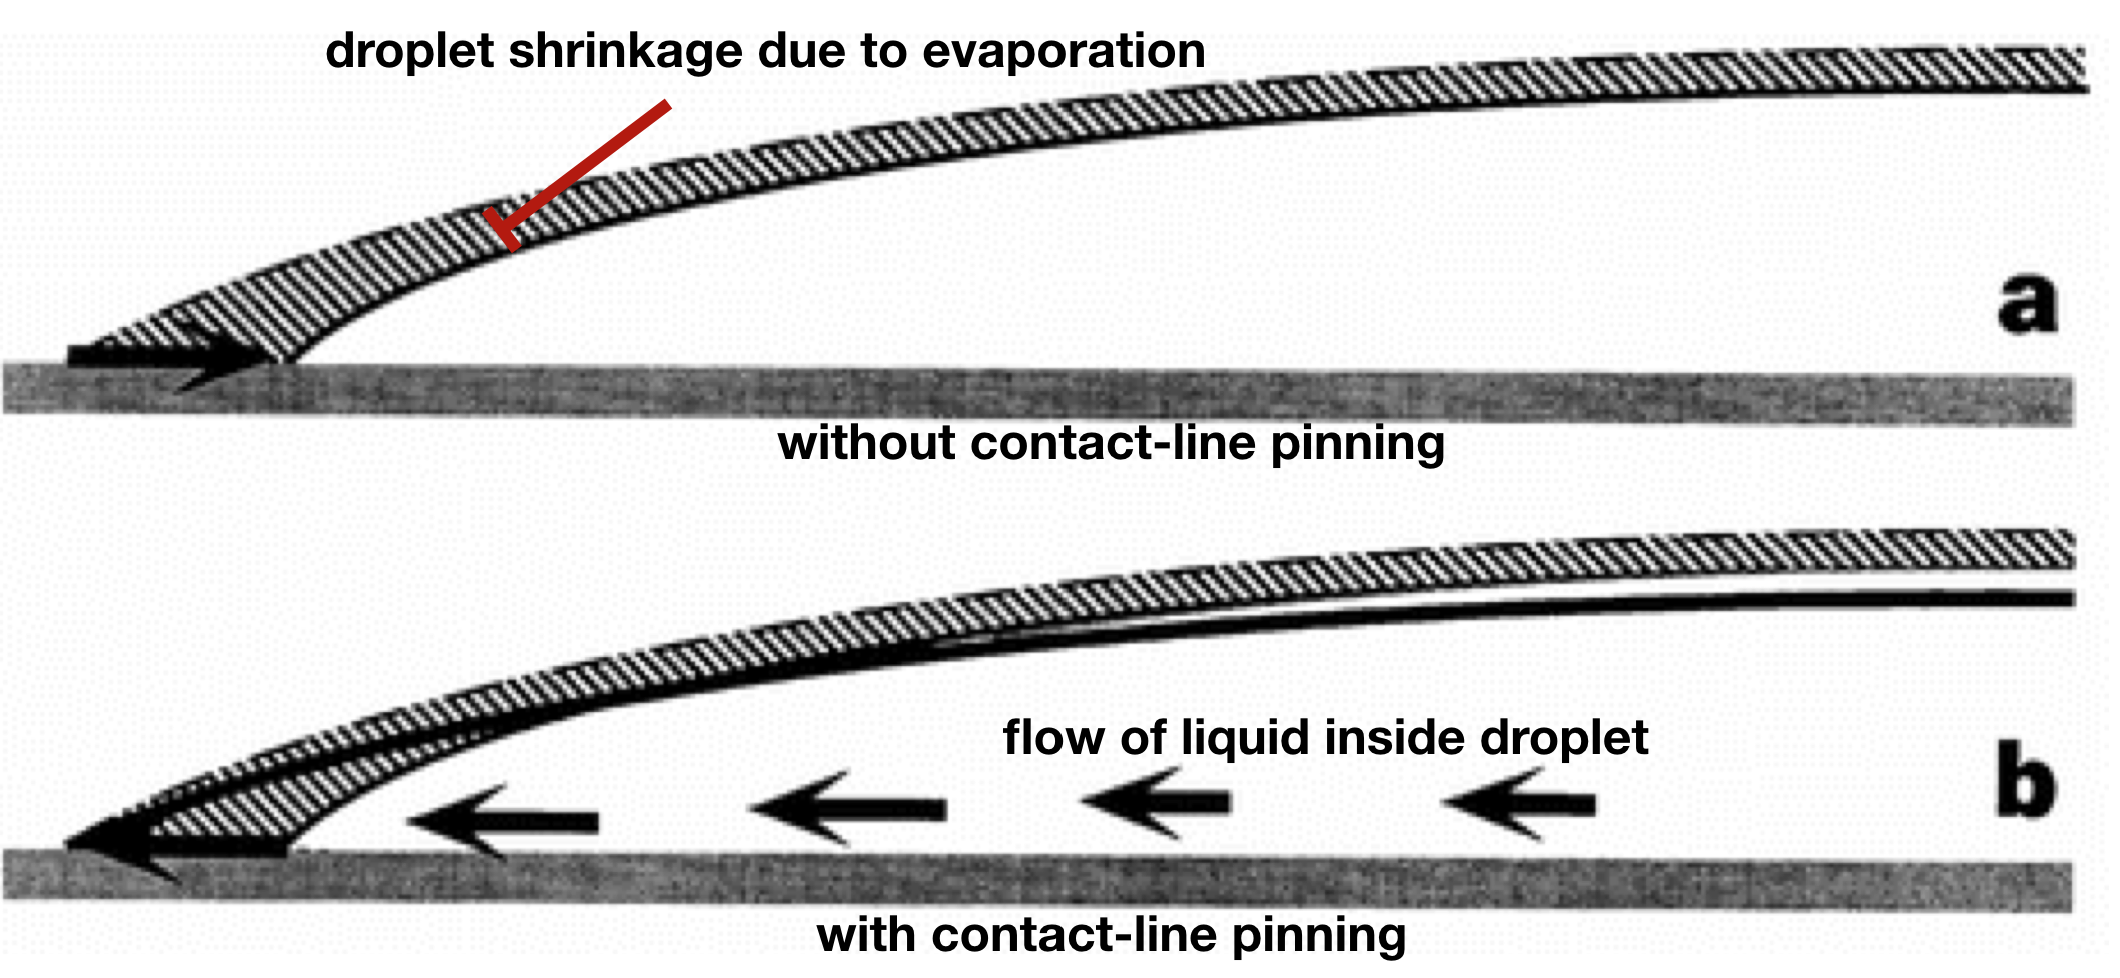
So now we know the conditions required for rings to form, but we want to know how they form. Deegan and his colleagues found that the rings are caused by a geometrical constraint. Here’s how it works: The pinning of the contact line means that the perimeter of the droplet cannot move, so the diameter of the droplet has to remain constant. But if the water in the droplet is evaporating, the droplet’s height will be reduced at every point (Figure 3a). Along the edges, where the droplet is thinnest, the height would be reduced to zero, and the droplet would shrink.
But the contact line pinning means that droplet can’t shrink. To prevent this shrinkage, liquid must flow out to replenish the liquid at the droplet edge as it evaporates. This flow brings with it the suspended coffee granules (or whichever solute is suspended in the solvent), pushing them outward until they pack at the edge of the droplet to form a ring (Figure 3b).
Figure 3. (a) Diagram showing the cross-section of a droplet on a surface. The shaded region shows how the droplet will shrink due to evaporation after a small amount of time if the contact line is not pinned. (b) Now, a black line is added to show how the droplet will shrink if the contact line is pinned. The arrows indicate that more liquid must flow to the outside of the droplet to replace what is lost to evaporation. Adapted from Deegan et. al.
By calculating how quickly water evaporates from the surface of a droplet, the researchers derived an expression for the mass of the ring as a function of time. It takes the form of a power law, which can be shown as a straight line on a log-log plot. Equipped with a quantitative prediction, the researchers set about performing experiments to test their model. Instead of using coffee, they opted for plastic microspheres suspended in drops of water. They placed the drops on glass slides and used a video microscope to image the droplets as they dried, recording the particles moving to the edges of the droplet (Figure 4).
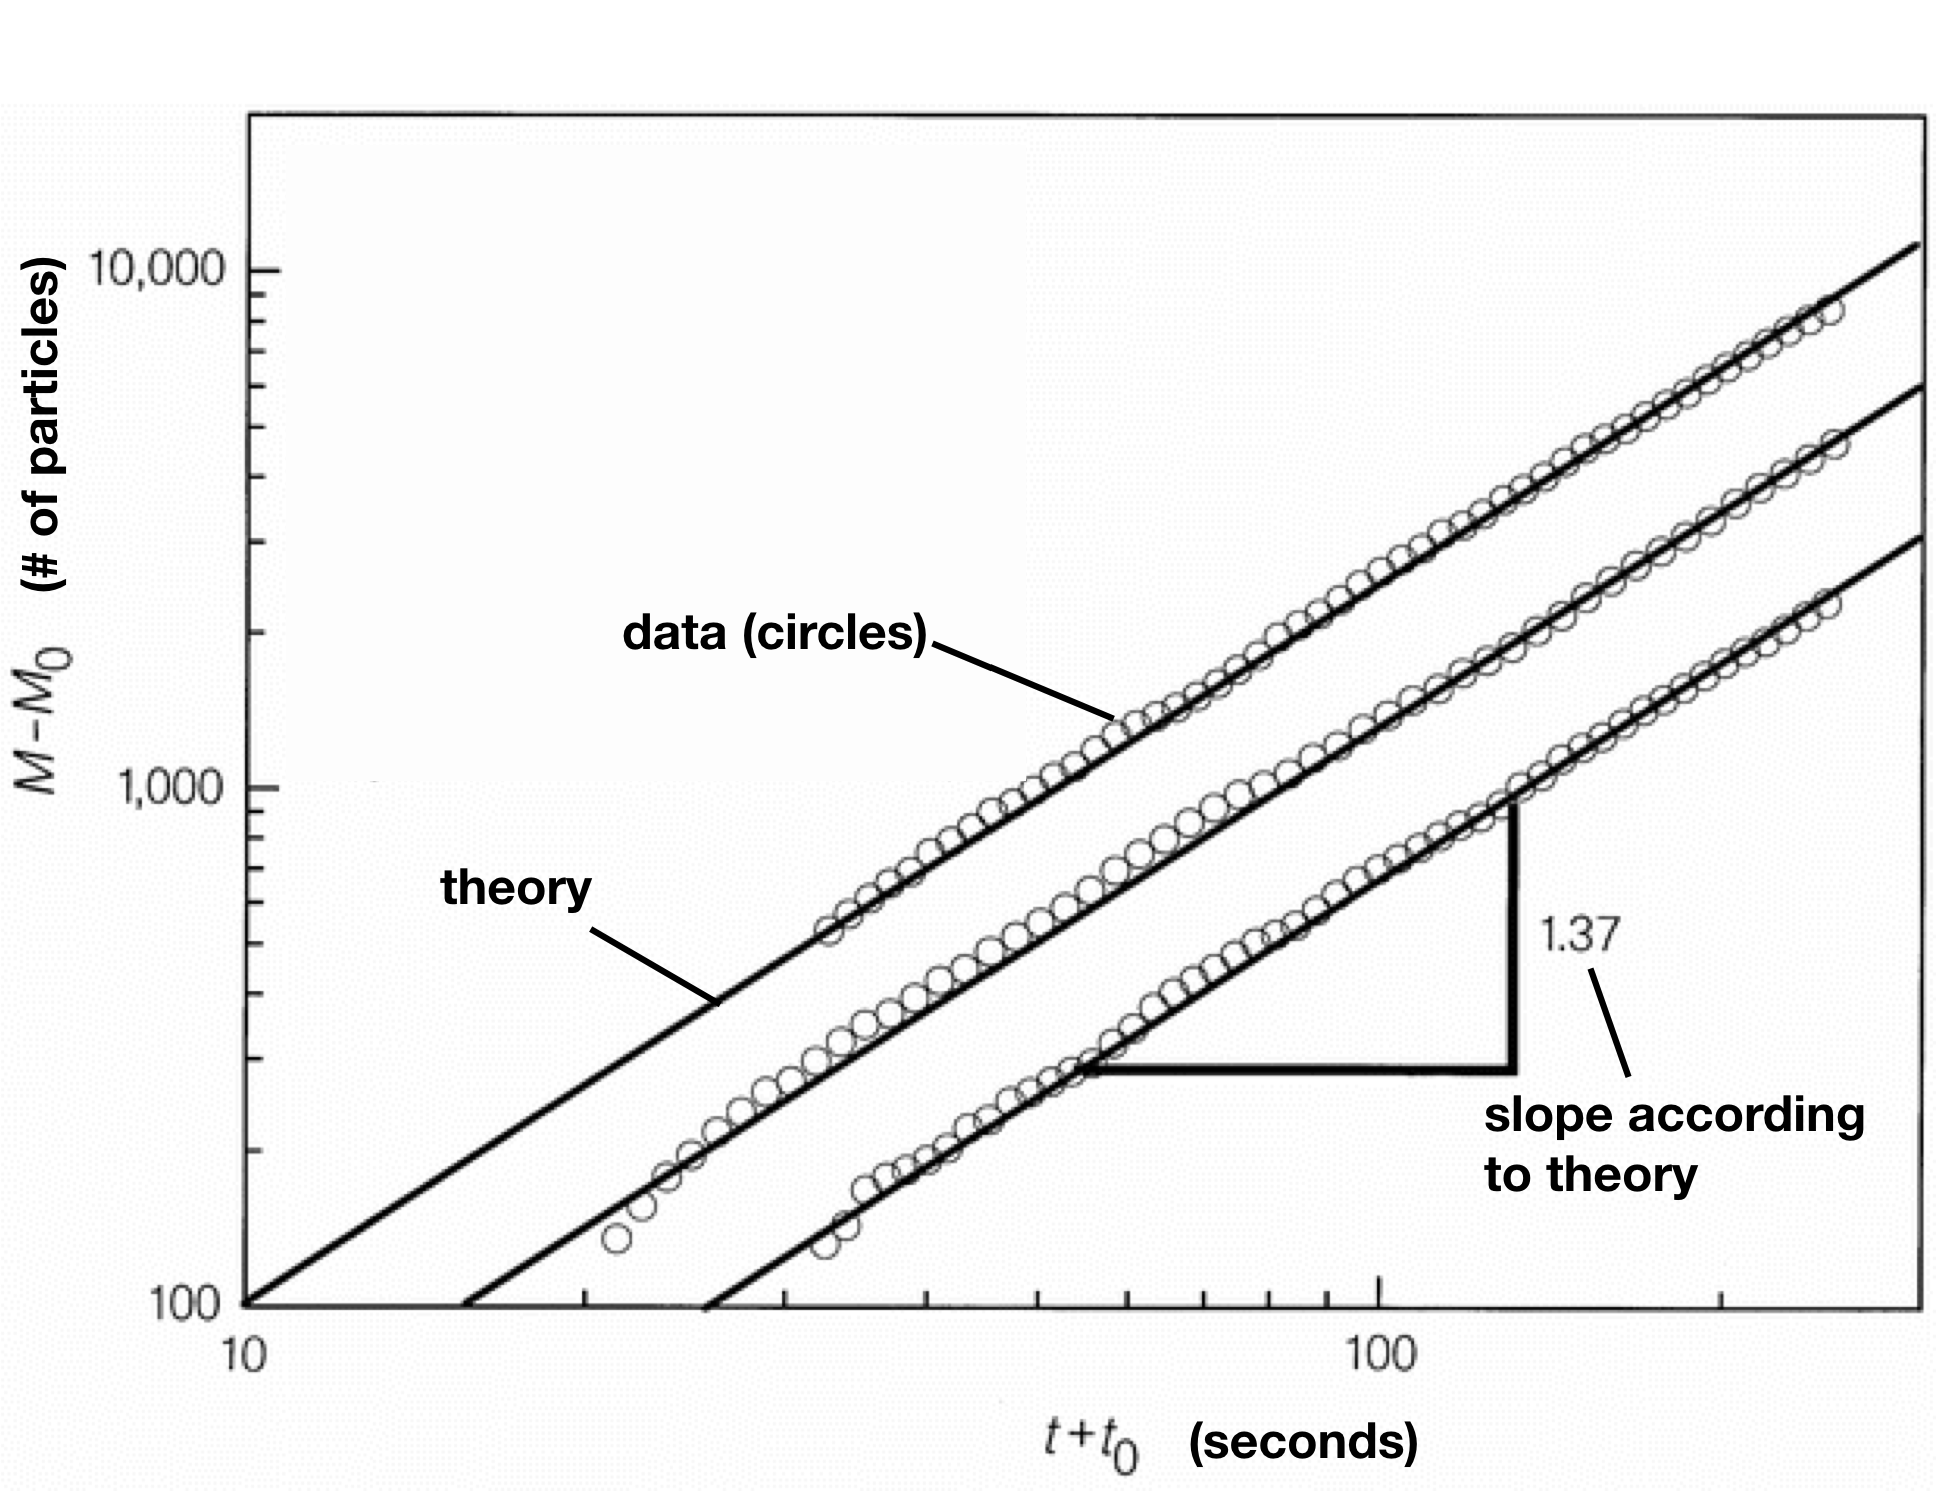
Figure 4. Particles flowing to the edge of a droplet during evaporation to form a ring. Video from [2] and produced by Deegan et. al.The researchers knew the mass of the individual particles, so they were able to calculate the mass of the ring as a function of time by counting the particles as they traveled to the edges. The results were shifted by an offset time t0 to account for early times where the power law prediction doesn’t hold and were shifted by mass M0 to account for the particles deposited during this initial stage. From the plot comparing the data and theory (Figure 5), we can see that the prediction shows good agreement with the data.
Figure 5. Plot of mass in the ring as a function of time. The mass is plotted in units of particle number, so the plot shows how the number of particles grows over time. The three lines correspond to three different droplets. The upper curve overlapped with the middle so was shifted up for clarity. The circles show data and the solid lines show the theoretical prediction. The slope of 1.37 is the exponent of the power law predicted by the theory; On a log-log plot, a power law is a line with the exponent as the slope. Adapted from Deegan et. al.
In the twenty years since this paper was published, the study of drying droplets has continued in full force [3]. Scientists have discovered various particle patterns that can form under different drying conditions. Why do we care so much about these drying droplets? If the beauty of the physics isn’t motivation enough, then maybe the applications will convince you. The physics of drying is essential to inkjet printing, and a better understanding of the drying process could help make more precise printers [4]. Drying patterns can be used to identify the presence of certain proteins, making this a potential tool for disease detection [5]. Maybe next time you spill some coffee, you’ll take a moment to think of the physics of the drying droplet before you wipe it away.
[1] The contact angle is the angle where a liquid-gas interface meets a solid surface. The smaller the contact angle, the better the wetting of the surface.
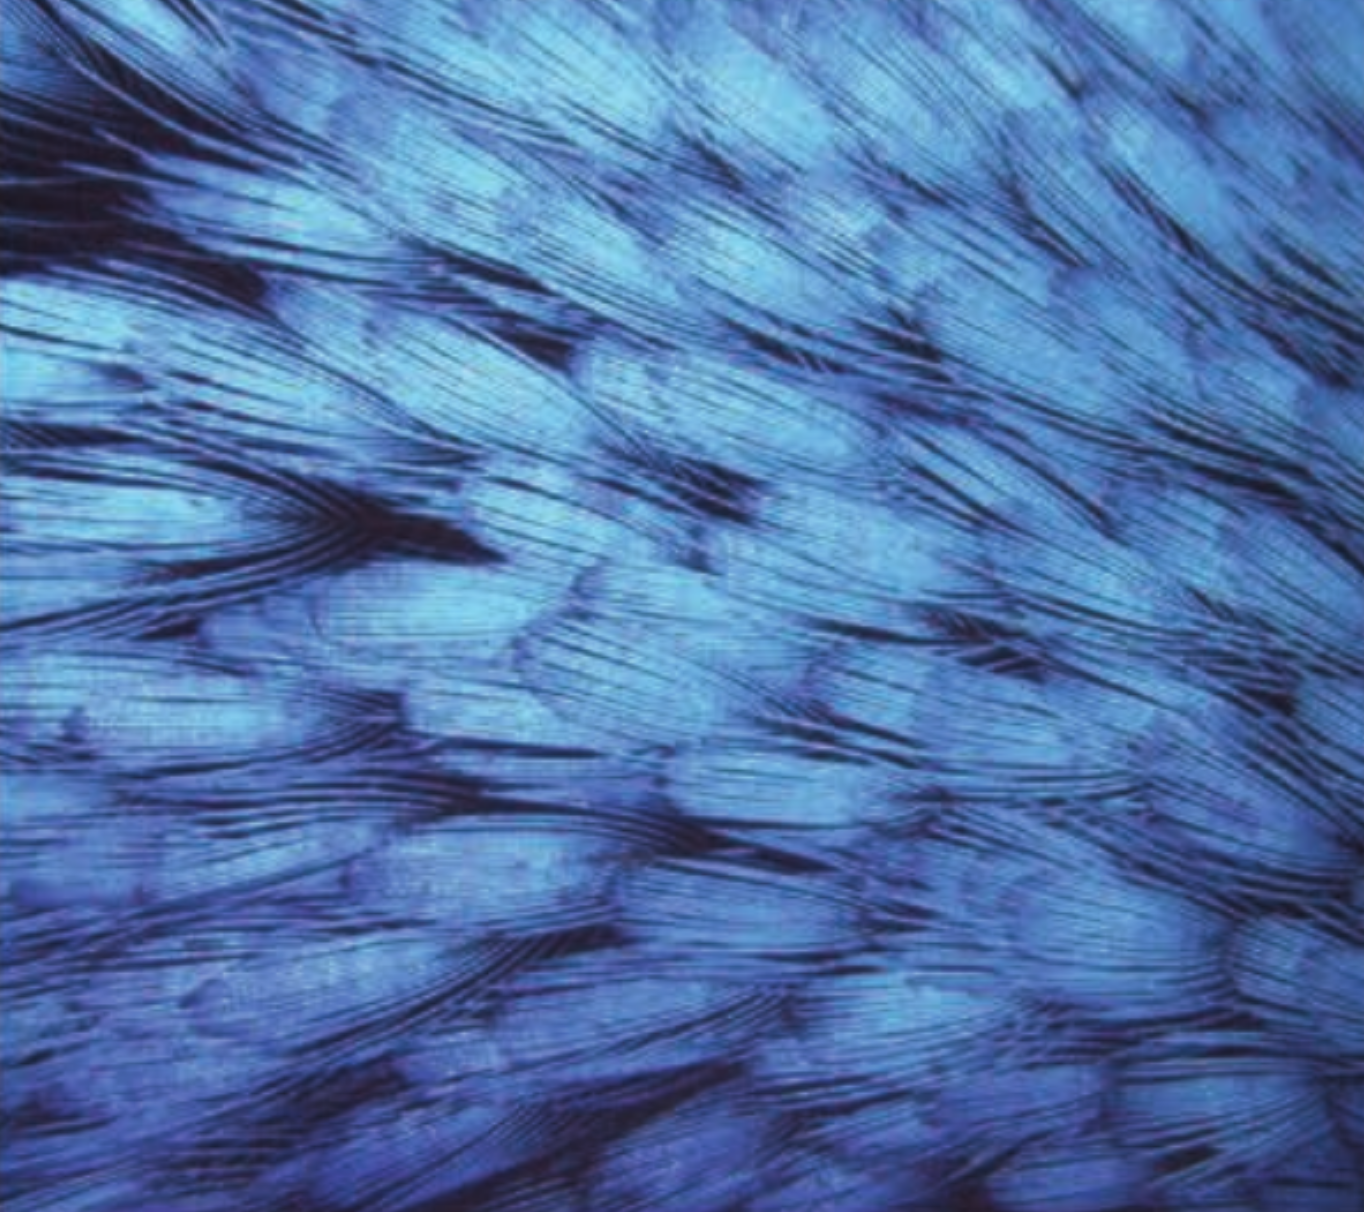
There’s a reason why the word “peacock” has become a verb synonymous with commanding attention. Of course, the size of the peacock tail is enough to turn heads, but it wouldn’t be nearly as beautiful without its signature iridescent, or angle-dependent, color. The brilliant colors of the peacock come from the interaction of light with the nanoscale structure of the feathers, which is much different from the origin of color in regular dyes and pigments. In today’s paper, Jason Forster and his colleagues in the Dufresne group developed a simple way to make colors that is inspired by the structures in certain bird feathers.
Figure 1. An iridescent peacock feather. Source: http://www.publicdomainpictures.net/pictures/100000/velka/peacock-feather.jpg
Colors come from the way our brain interprets different wavelengths of light. Most colors we encounter in dyes and paints are a result of absorption. Certain chemicals absorb specific wavelengths of light, and the other wavelengths are reflected; the colors we see are due to those reflected wavelengths. However, not all colors come from absorption. The color of the sky is perhaps the most widely seen example of this. The molecules that make up air scatter much more light at small wavelengths, which corresponds to blue light.
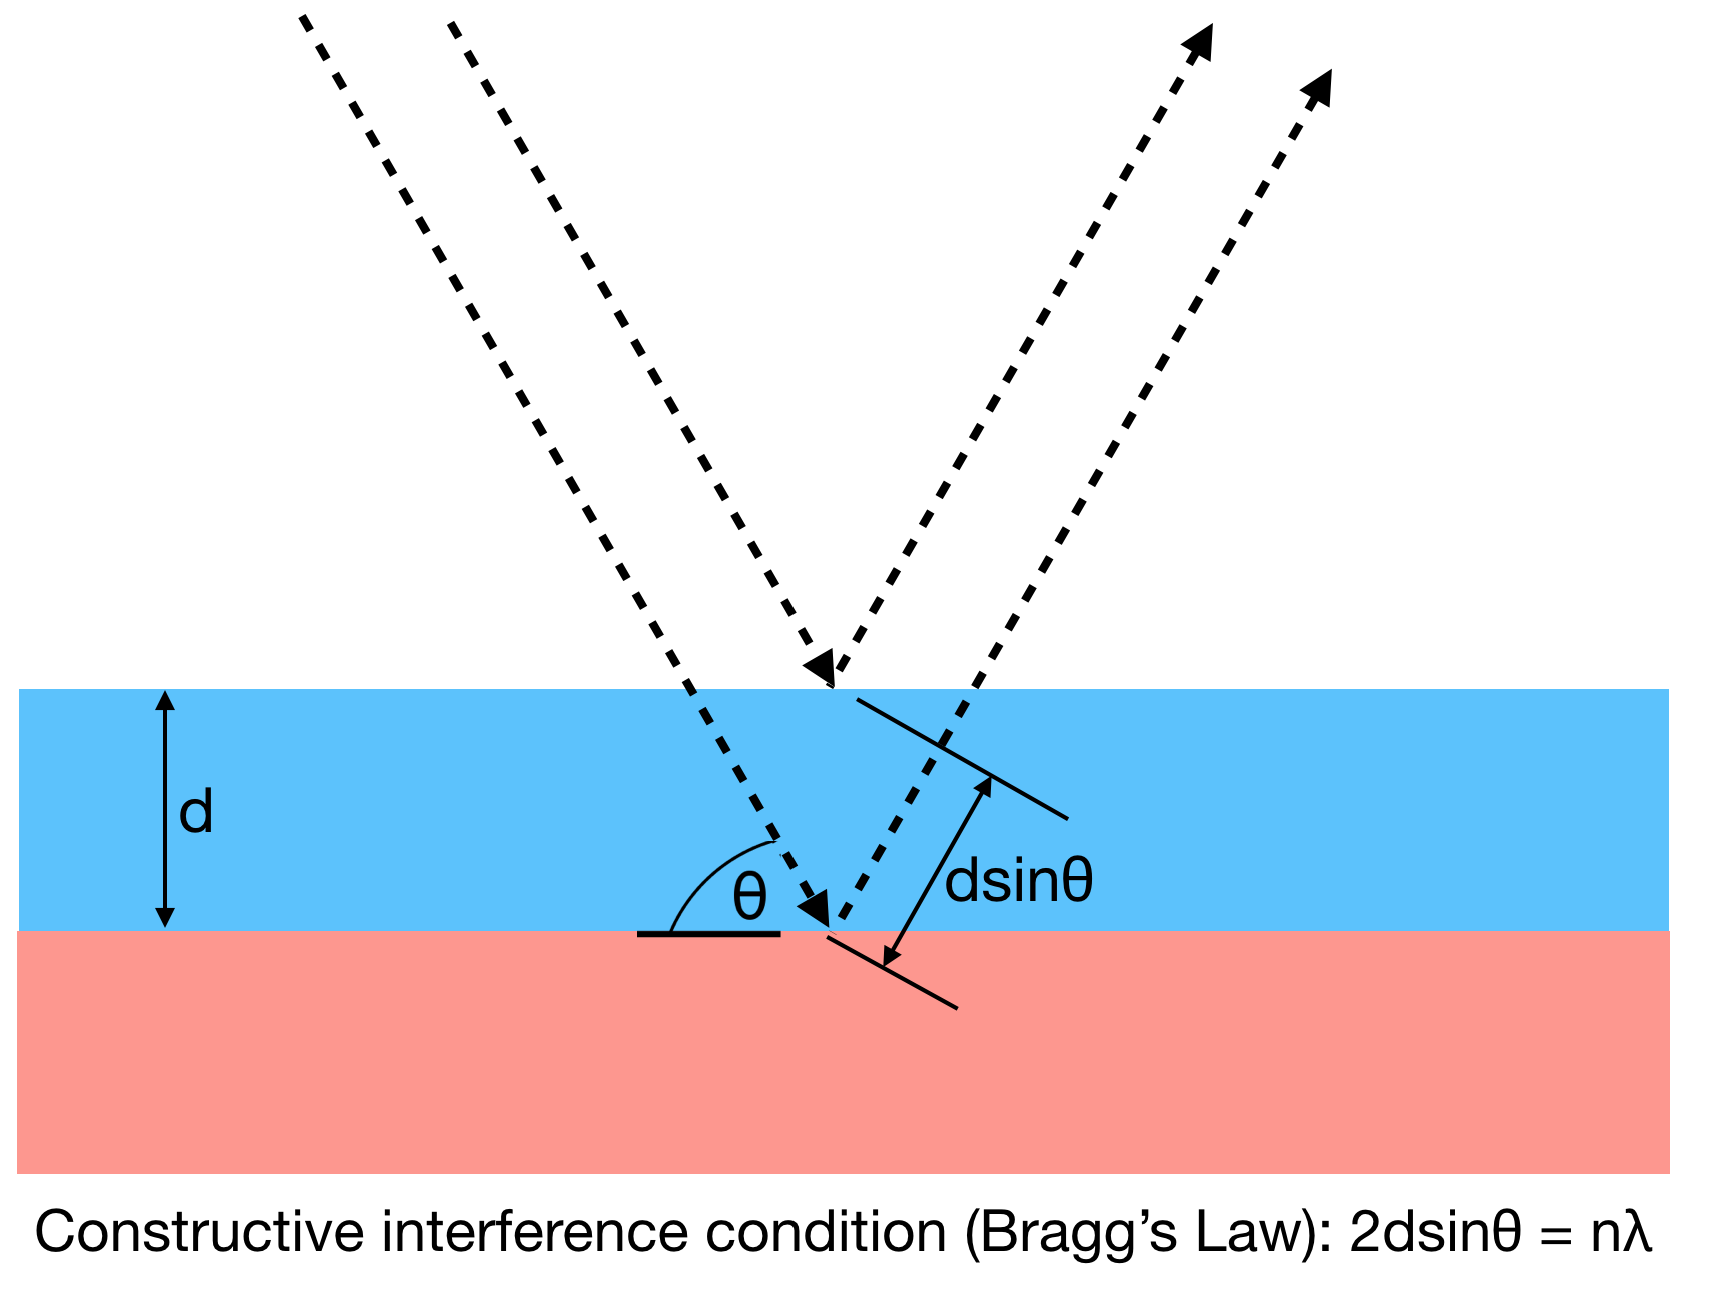
The iridescence of the colors in the peacock feather is caused by constructive interference due to the nanoscale structure of the feather. To explain this, let’s look at a simplified picture. If you have a layered stack of materials, some light will be reflected from each layer in the stack (Figure 2). Since the light reflected from the layers at the bottom stack will have traveled farther, the different sets of reflected waves will be shifted out of phase. When the waves are shifted by exactly one wavelength, they add constructively and give a stronger reflection. This constructive interference happens at a wavelength which depends on the thickness of the layers, their index of refraction, and the angle at which the light is sent and detected. Structural color is a result of the stronger reflectance at a particular wavelength due to this constructive interference of light.
Figure 2. Diagram depicting path length difference from reflection from different layers that gives rise to constructive interference.
Structural color can arise in many different types of structures, from bird feathers and butterfly wings to soap bubbles and opals, but today’s paper is about a type of structural color made from plastic spherical particles. These spheres are only a few hundred nanometers in diameter, on the order of the wavelength of visible light, and they are so small that they can remain suspended in water for long periods of time, forming a colloidal suspension. Jason Forster and his colleagues in the Dufresne group made structurally colored films by starting with a small volume of a colloidal suspension of these particles and allowing it to dry, causing the particles to pack together and self-assemble into structures with color.
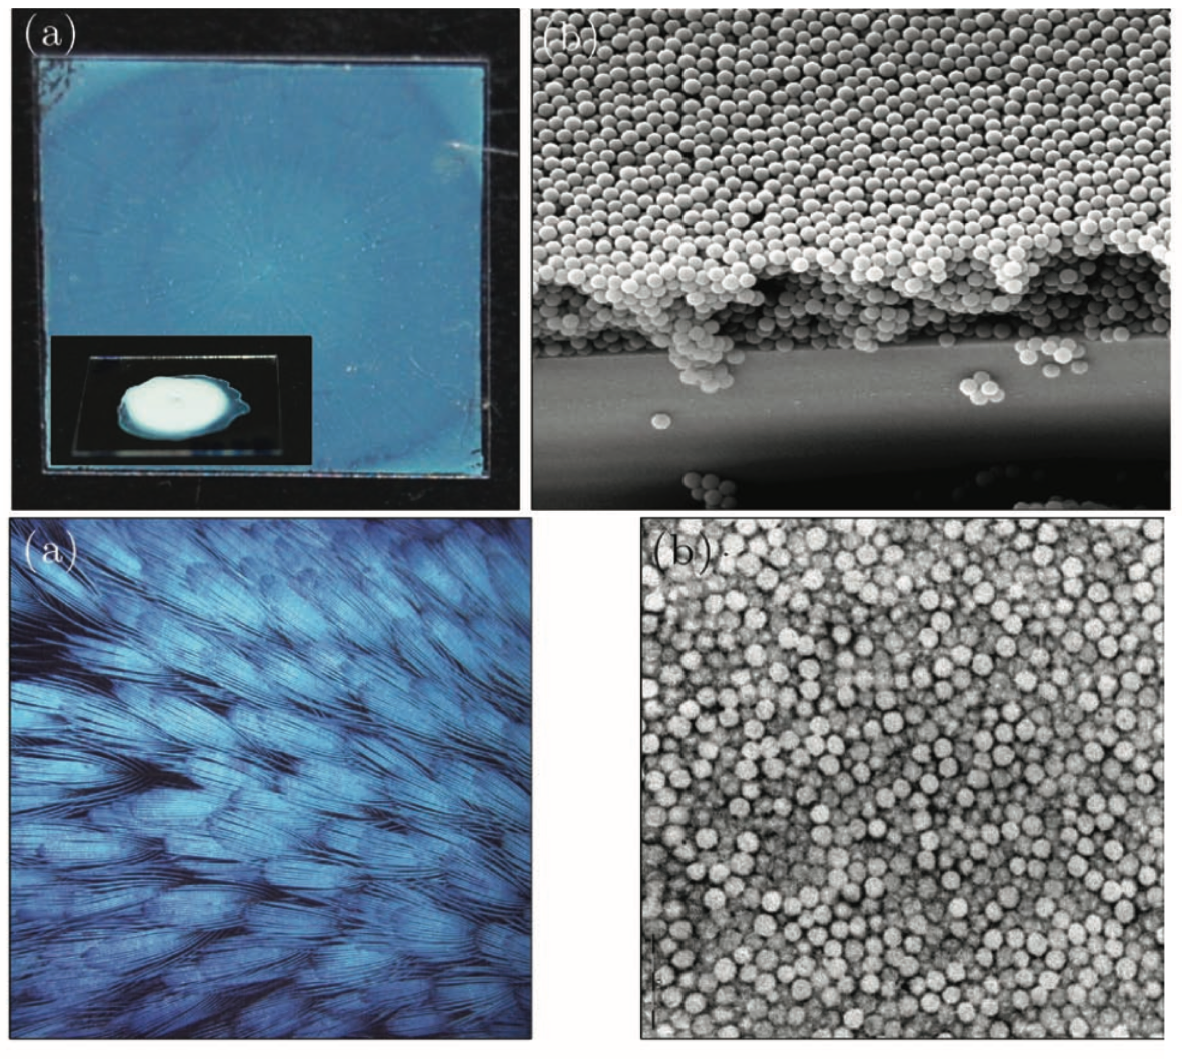
The way the particles packed greatly impacted the color of the film. When the researchers used spheres that were all the same size, the particles formed a crystal (an ordered arrangement made of a repeating unit cell) as the suspension dried. In a crystalline structure such as the peacock feather, the structural color is iridescent, or angle-dependent. This angle-dependence of color arises because the angle that light is sent into the sample will affect the distance it travels through the material, therefore changing the wavelength at which the light will constructively interfere. However, the researchers found that when they mixed spheres of two different sizes, the spheres could no longer form a crystal, and instead formed a disordered structure (Figure 3, top). This structure was isotropic, meaning that it looked the same from any angle. The structural color of a crystalline sample is iridescent because light travels different path lengths through it at different angles. Because the isotropic structure is essentially the same at all angles, the color is the same at all angles.
Figure 3. Top left: Photo of a structurally colored film. Top right: Scanning electron micrograph of particles in a film comparable to the one on the left. Bottom left: Photo of bird feathers of Lipodothrix Coronata. Bottom right: Tunneling electron micrograph of bird feathers on the left. Adapted from Forster et al.
By making a more disordered structure, Forster and his colleagues were able to make a more uniform color! These disordered assemblies of spheres bear a striking resemblance to the nanoscale structures found in bird feathers such as Lipodothrix Coronata (Figure 3, bottom), which are made up air spheres embedded in a disordered array inside a matrix of beta-keratin. These bird feathers have a color similar to the particle films made by the researchers: a blue color that doesn’t change with angle.
Our eyes are a useful tool for observing colors, but they are not the most precise way to measure light. If we want to compare colors precisely and quantitatively, the best way to do that is by looking at a reflectance spectrum. A reflectance spectrum tells you the amount of light reflected from an object at a range of wavelengths. You can measure a reflectance spectrum by shining light at a colored sample and using a spectrometer to detect the reflected light. Combined with a computer, a spectrometer allows you to record an intensity value for a range of wavelengths, giving you a full intensity spectrum. The reflectance spectrum is found by normalizing this data against a perfect reflector such as a mirror or a white material, giving you the percent of light reflected at each wavelength. So if you were to measure the reflectance of a blue material, you would have a spectrum with a peak in the wavelengths that correspond to blue light (~450-495 nm).
One way to infer the reflectance spectrum of a material that has no absorption is to measure transmittance. To measure the transmittance spectrum, you can move the detector to the side opposite to the incident light, so it detects the light that goes through the sample. If you were to measure the transmittance spectrum of this same blue material, you would expect to see a dip corresponding to the blue wavelengths. The blue light would not make it through to the other side because it was reflected.
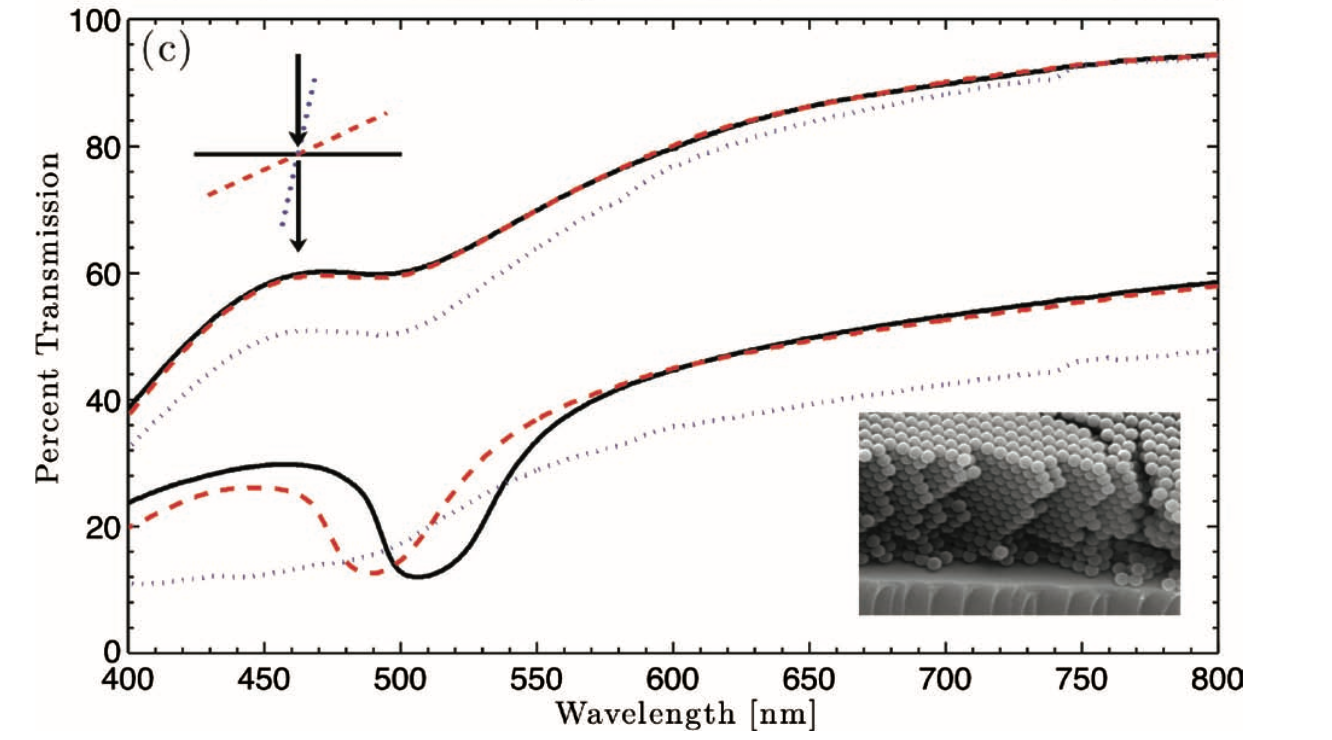
The researchers measured the transmittance spectra for their structurally colored samples and found that the blue isotropic structural color and the blue crystalline structures both showed a dip in the blue wavelengths (Figure 4). However, the dip in the isotropic structure data was much broader and more shallow, meaning that less light was reflected at that wavelength, making the color less bright and saturated.
Figure 4. Transmittance spectra for isotropic and crystalline samples. The top three curves are spectra for the isotropic samples at different angles. The bottom three curves are spectra for the crystalline samples at different angles. Top inset: diagram showing sample angles. Bottom inset: scanning electron micrograph for a crystalline sample. Adapted from Forster et al.
But the quality of the color wasn’t the only thing that changed in the spectra of the isotropic structures. In these samples, the transmittance dip stayed at the same range of wavelengths even when the measurement angle changed, while the dip in the spectrum of the crystalline structure shifted as the measurement angle was changed. By eye, the researchers also saw that the disordered structures made angle-independent color, and the ordered structures made iridescent color. The measurements of the crystalline and isotropic structures show that there is a tradeoff between saturation and angle-independence in structural color.
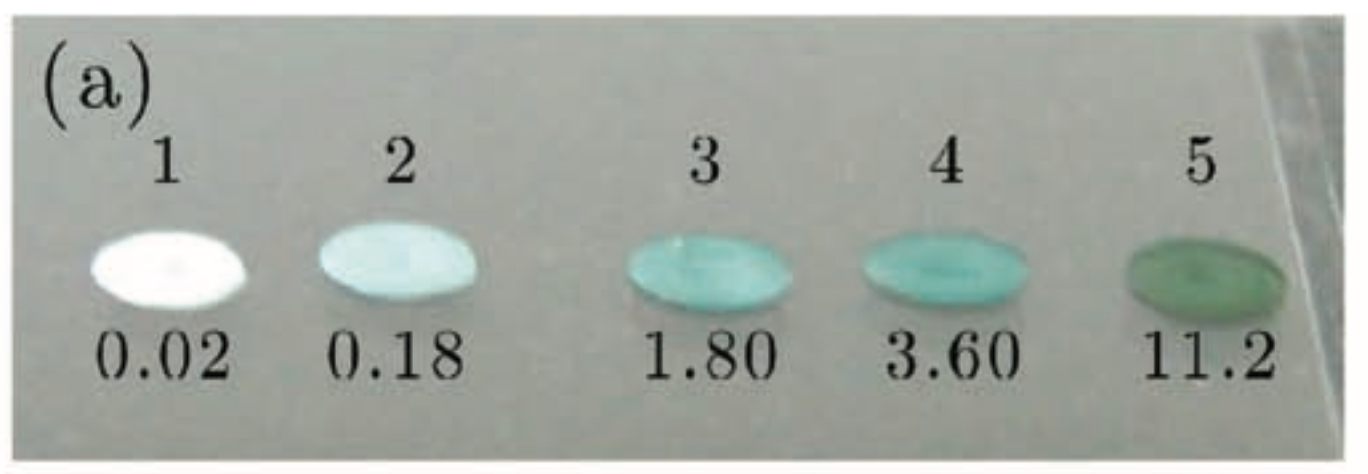
The thickness of these isotropic structurally colored films also greatly affected the saturation of their color. Films that were just a few micrometers thick had a bright blue color, while much thicker films looked nearly white. The researchers found that adding some carbon black– black nanoparticles that absorb light at all visible wavelengths– made the colors of the thick films more vibrant (Figure 5). The carbon black works by reducing the effective thickness of the samples, absorbing light before it can travel through the entire layer of the sample and causing it to look like a thinner sample.
Figure 5: Isotropic structurally colored films with different amounts of carbon black. The concentrations of carbon black as weight percent are listed beneath the samples. Adapted from Forster et al.
This work showed that structural color, both iridescent and angle-independent, can be made using simple methods that could potentially make the colors in large volumes for real-world applications. Because these colors come from structure and not absorption, they will not fade over time as current dyes do. In addition, one material can be used to make a range of different colors by tuning the structure, so these assemblies could be used as colorimetric sensors that change color in response to environmental changes such as strain or temperature.